Analysis Steps
Contents
Analysis Steps
ALLCools covers two parts of analysis:
Cellular analysis, including
Genomic analysis, including
In general, the cellular analysis is focused on individual cells’ overall diversity using genomic features (e.g., kilobase-level regions or whole gene body). One of the key results from cellular analysis is the identification of cell clusters. We will then merge the single-cell methylome and other profiles to pseudo-bulk level based on the cluster labels, which gives us enough coverage to perform genomic analysis at hundred-bp or even single-base resolution.
Cellular Analysis
Sections
Input
Cell metadata contains quality metrics (defined by user; used in basic cell filtering).
Cell-by-feature MCDS files generated from single-cell ALLC files via
allcools generate-dataset.
Two Clustering Strategies for different tissue types
Clustering using raw counts from 100Kb genomic bins
In this strategy, we start from the cell-by-100kb-bin raw count matrix (MCDS) for clustering analysis. Here is a quick demo and its step-by-step descriptions can be found here.
We found [Liu et al., 2021] using 100Kb genomic bins provides good clustering ability and is also computationally efficient due to the relatively small number of features (27K features in mm10, v.s. 540K features using 5Kb bins). We also tested the effect of different feature sizes when clustering adult mouse brain single-cell methylomes and found that feature sizes do not have a major impact on the clustering results [Liu et al., 2021]. However, this conclusion may not apply to all tissues, as the scale of methylation diversity might be different in different tissues or cell types. We suggest using the 100Kb bin size as a starting point and testing other bin sizes when necessary. That being said, the allcools generate-dataset does provide the flexibility to generate feature matrix at any bin size or through user-defined region sets.
Clustering using hypo-methylation score from 5Kb genomic bins
We also noticed that for some non-brain tissues (pituitary, PBMC etc.), the 100Kb bin clustering strategy had a hard time identifying some known cell types. One possible explanation is that the methylation diversity of these cell types mainly occur at small discontinuous regulatory regions (DMRs) while the large 100Kb bins can only capture DMG or large-hypo DMR level diversities. To solve this problem, we developed another strategy by using algorithms adapted from snATAC-seq on small genomic bins (5Kb by default).
Specifically, this strategy starts from a cell-by-5kb-bin hypo-methylation score matrix for clustering analysis. Here is a quick demo and its step-by-step descriptions can be found here.
Genomic Analysis
Sections
Basic process of genomic analysis
Starting from single-cell ALLC files and cluster labels from the cell-level analysis, there are three steps for preparing cluster-level data files.
We create pseudo-bulk ALLC files by merging from single-cell ALLC files via
allcools merge.We then use proper algorithms to identify DMRs. The expected results of this step are a DMR region list and associated statistics.
Using the DMR regions and additional datasets, we can annotate DMRs with multiple kinds of information and store the DMR-by-feature information in RegionDS format.
After getting a rich annotated RegionDS, we can perform following analysis, such as motif enrichment, region-region correlation, enhancer prediction.
The genomic analysis model is illustrated in the following figure:
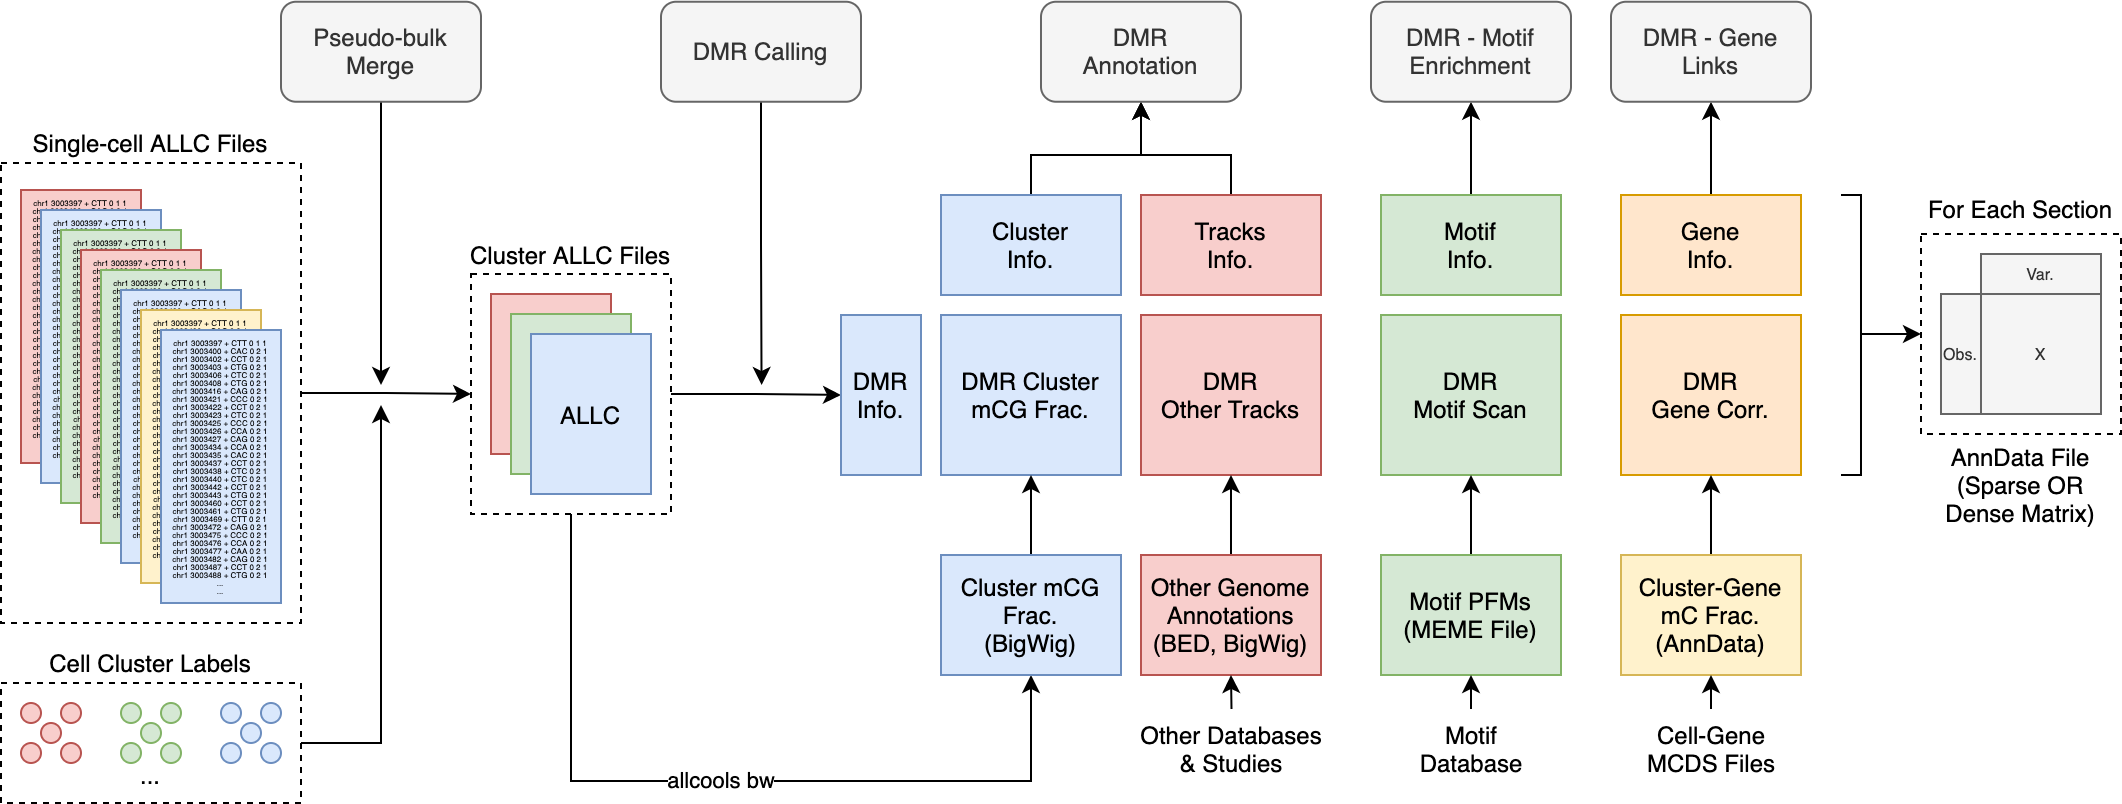
Fig. 6 Cluster level analysis data model.