Decomposition Using mCG-5Kb Bins
Contents
Decomposition Using mCG-5Kb Bins
Content
Input
MCDS file
Cell metadata
Output
Cell-by-5kb-bin AnnData (sparse matrix) with embedding coordinates and cluster labels.
Import
import numpy as np
import pandas as pd
import seaborn as sns
import matplotlib.pyplot as plt
import anndata
import scanpy as sc

from ALLCools.clustering import \
    tsne, \
    significant_pc_test, \
    filter_regions, \
    remove_black_list_region, \
    lsi, \
    binarize_matrix
from ALLCools.plot import *
from ALLCools.mcds import MCDS
Parameters
metadata_path = 'CellMetadata.PassQC.csv.gz'
mcds_path = '../../../data/PIT/RufZamojski2021NC.mcds/'

# PC cutoff
pc_cutoff = 0.1

resolution = 1
Load Cell Metadata
metadata = pd.read_csv(metadata_path, index_col=0)
print(f'Metadata of {metadata.shape[0]} cells')
metadata.head()
Metadata of 2756 cells
| CellInputReadPairs | MappingRate | FinalmCReads | mCCCFrac | mCGFrac | mCHFrac | Plate | Col384 | Row384 | CellTypeAnno | |
|---|---|---|---|---|---|---|---|---|---|---|
| index | ||||||||||
| PIT_P1-PIT_P2-A1-AD001 | 1858622.0 | 0.685139 | 1612023.0 | 0.003644 | 0.679811 | 0.005782 | PIT_P1 | 0 | 0 | Outlier |
| PIT_P1-PIT_P2-A1-AD004 | 1599190.0 | 0.686342 | 1367004.0 | 0.004046 | 0.746012 | 0.008154 | PIT_P1 | 1 | 0 | Gonadotropes |
| PIT_P1-PIT_P2-A1-AD006 | 1932242.0 | 0.669654 | 1580990.0 | 0.003958 | 0.683584 | 0.005689 | PIT_P1 | 1 | 1 | Somatotropes |
| PIT_P1-PIT_P2-A1-AD007 | 1588505.0 | 0.664612 | 1292770.0 | 0.003622 | 0.735217 | 0.005460 | PIT_P2 | 0 | 0 | Rbpms+ |
| PIT_P1-PIT_P2-A1-AD010 | 1738409.0 | 0.703835 | 1539676.0 | 0.003769 | 0.744640 | 0.006679 | PIT_P2 | 1 | 0 | Rbpms+ |
Load MCAD
mcds = MCDS.open(mcds_path, var_dim='chrom5k')
mcds.add_cell_metadata(metadata)
mcds = mcds.remove_black_list_region(black_list_path='../../../data/genome/mm10-blacklist.v2.bed.gz')
49908 chrom5k features removed due to overlapping (bedtools intersect -f 0.2) with black list regions.
mcad = mcds.get_score_adata(mc_type='CGN', quant_type='hypo-score')
mcad
AnnData object with n_obs × n_vars = 2756 × 495206
    obs: 'CellInputReadPairs', 'MappingRate', 'FinalmCReads', 'mCCCFrac', 'mCGFrac', 'mCHFrac', 'Plate', 'Col384', 'Row384', 'CellTypeAnno'
    var: 'chrom', 'end', 'start'
Binarize
binarize_matrix(mcad, cutoff=0.95)
Filter Features
filter_regions(mcad)
Filter out 206777 regions with # of non-zero cells <= 13
array([False, False, False, ..., True, True, True])
mcad
AnnData object with n_obs × n_vars = 2756 × 288429
    obs: 'CellInputReadPairs', 'MappingRate', 'FinalmCReads', 'mCCCFrac', 'mCGFrac', 'mCHFrac', 'Plate', 'Col384', 'Row384', 'CellTypeAnno'
    var: 'chrom', 'end', 'start'
LSI Decomposition
Run LSI
# by default we save the results in adata.obsm['X_pca'] which is the scanpy defaults in many following functions
# But this matrix is not calculated by PCA
lsi(mcad, algorithm='arpack', obsm='X_pca')

# choose significant components
n_components = significant_pc_test(mcad, p_cutoff=pc_cutoff, update=True)
13 components passed P cutoff of 0.1.
Changing adata.obsm['X_pca'] from shape (2756, 100) to (2756, 13)
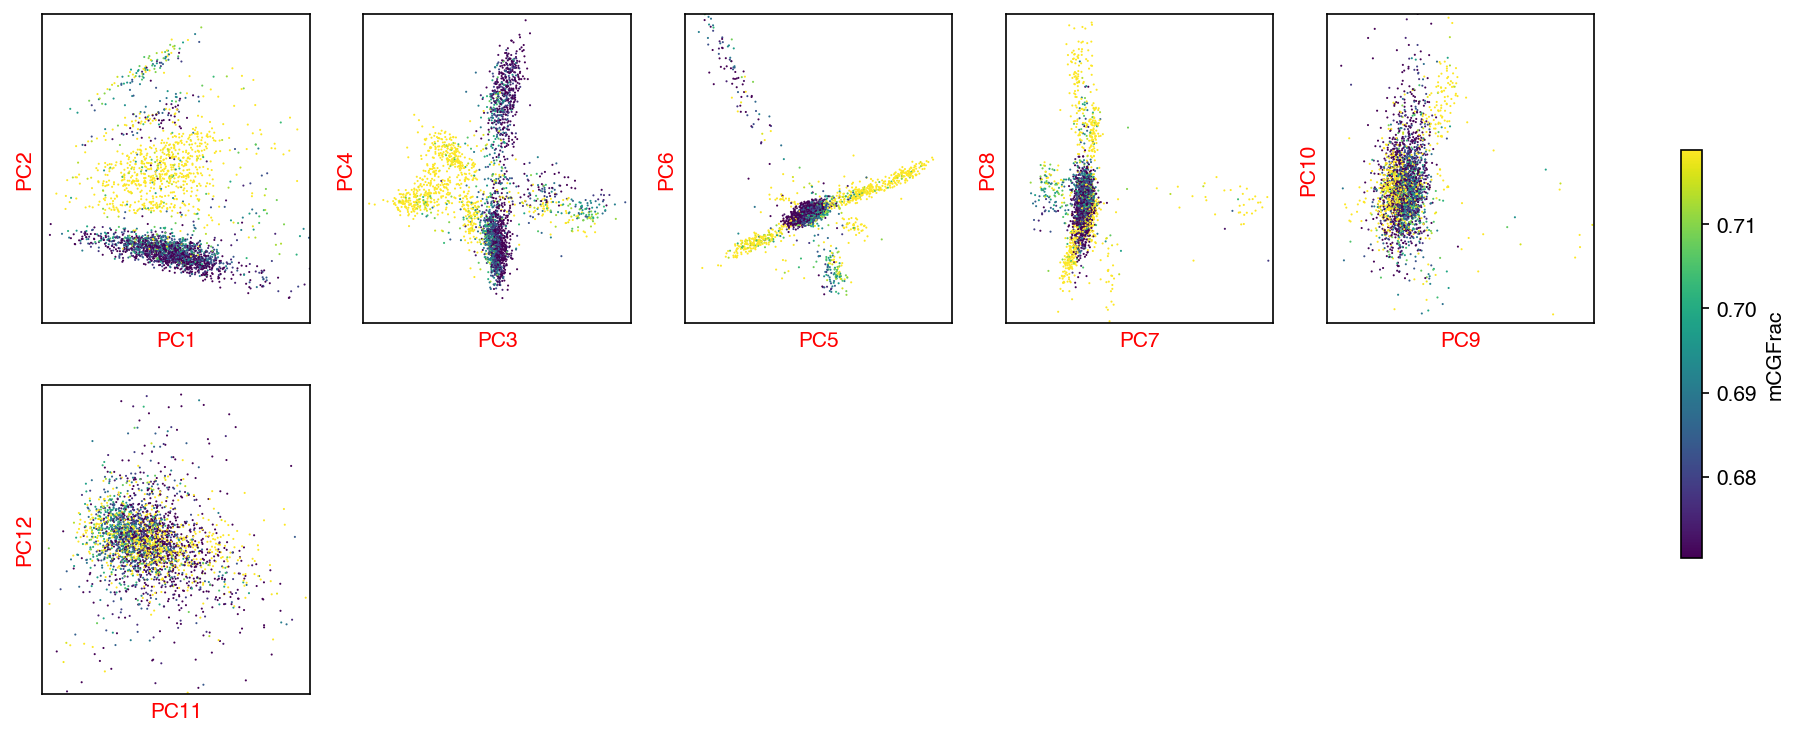
Plot
hue = 'mCGFrac'
if hue in metadata.columns:
    mcad.obs[hue] = metadata[hue].reindex(mcad.obs_names)
    fig, axes = plot_decomp_scatters(mcad,
                                     n_components=n_components,
                                     hue=hue,
                                     hue_quantile=(0.25, 0.75),
                                     nrows=5,
                                     ncols=5)
Red axis labels are used PCs
Basic Clustering
sc.pp.neighbors(mcad)
sc.tl.leiden(mcad, resolution=resolution)
Manifold learning
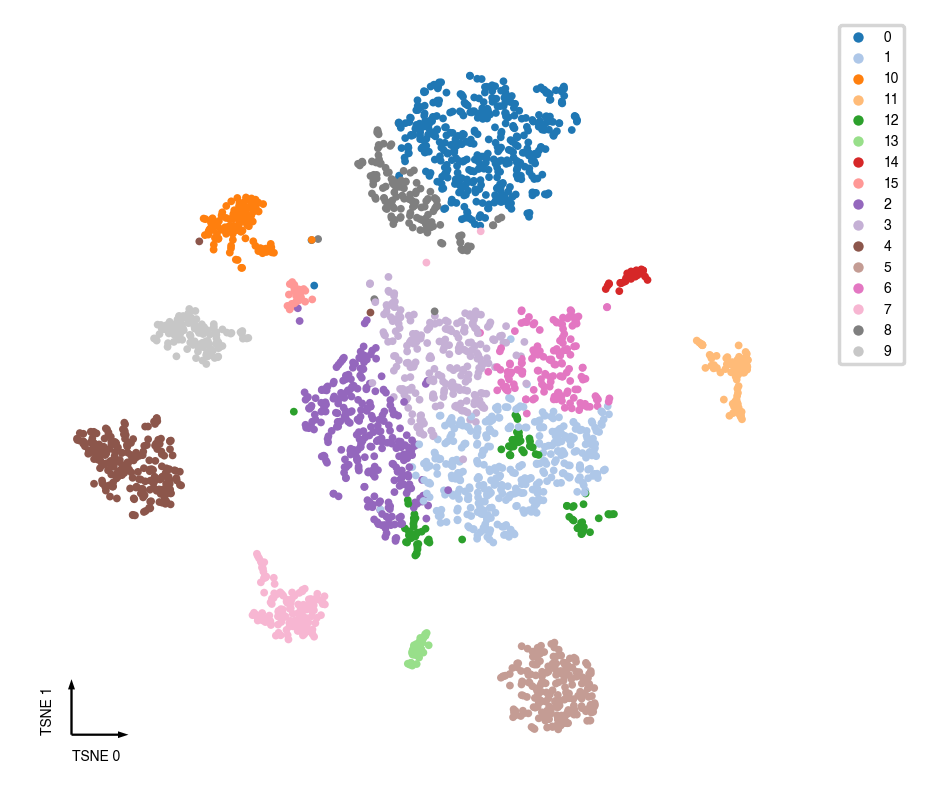
tSNE
tsne(mcad,
     obsm='X_pca',
     metric='euclidean',
     exaggeration=-1,  # auto determined
     perplexity=30,
     n_jobs=-1)
fig, ax = plt.subplots(figsize=(4, 4), dpi=250)
_ = categorical_scatter(data=mcad, ax=ax, coord_base='tsne', hue='leiden', show_legend=True)
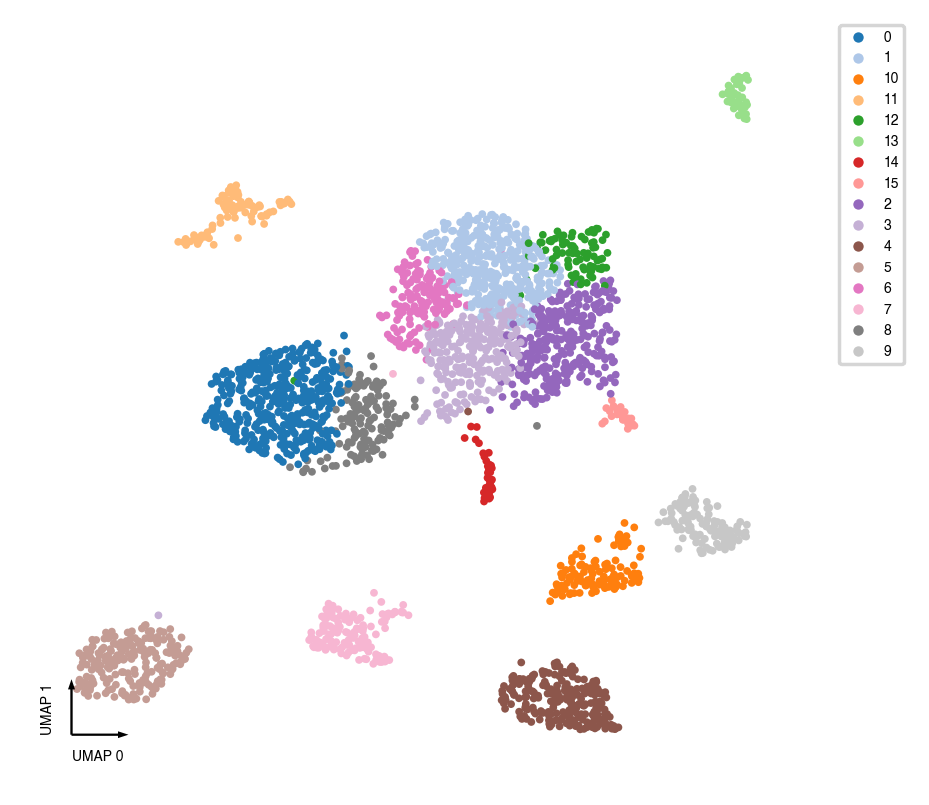
UMAP
try:
    sc.tl.paga(mcad, groups='leiden')
    sc.pl.paga(mcad, plot=False)
    sc.tl.umap(mcad, init_pos='paga')
except:
    sc.tl.umap(mcad)
/home/hanliu/miniconda3/envs/allcools_new/lib/python3.8/site-packages/anndata/_core/anndata.py:1228: FutureWarning: The `inplace` parameter in pandas.Categorical.reorder_categories is deprecated and will be removed in a future version. Reordering categories will always return a new Categorical object.
  c.reorder_categories(natsorted(c.categories), inplace=True)
... storing 'Plate' as categorical
/home/hanliu/miniconda3/envs/allcools_new/lib/python3.8/site-packages/anndata/_core/anndata.py:1228: FutureWarning: The `inplace` parameter in pandas.Categorical.reorder_categories is deprecated and will be removed in a future version. Reordering categories will always return a new Categorical object.
  c.reorder_categories(natsorted(c.categories), inplace=True)
... storing 'CellTypeAnno' as categorical
/home/hanliu/miniconda3/envs/allcools_new/lib/python3.8/site-packages/anndata/_core/anndata.py:1228: FutureWarning: The `inplace` parameter in pandas.Categorical.reorder_categories is deprecated and will be removed in a future version. Reordering categories will always return a new Categorical object.
  c.reorder_categories(natsorted(c.categories), inplace=True)
... storing 'chrom' as categorical
fig, ax = plt.subplots(figsize=(4, 4), dpi=250)
_ = categorical_scatter(data=mcad, ax=ax, coord_base='umap', hue='leiden', show_legend=True)
Interactive Scatter
interactive_scatter(data=mcad, hue='leiden', coord_base='umap')
Save results
mcad.write_h5ad(f'adata.with_coords.mcad')
mcad
AnnData object with n_obs × n_vars = 2756 × 288429
    obs: 'CellInputReadPairs', 'MappingRate', 'FinalmCReads', 'mCCCFrac', 'mCGFrac', 'mCHFrac', 'Plate', 'Col384', 'Row384', 'CellTypeAnno', 'leiden'
    var: 'chrom', 'end', 'start'
    uns: 'neighbors', 'leiden', 'paga', 'leiden_sizes', 'umap'
    obsm: 'X_pca', 'X_tsne', 'X_umap'
    obsp: 'distances', 'connectivities'