Preprocess snATAC-seq
Contents
Preprocess snATAC-seq
import matplotlib.pyplot as plt
import anndata
import scanpy as sc

from ALLCools.clustering import remove_black_list_region, significant_pc_test, binarize_matrix, filter_regions, lsi
from ALLCools.plot import *
Load data
5Kb bins raw counts matrix from snATAC-seq
adata = anndata.read_h5ad('../../input/snATAC.5kb.Neuron.h5ad')
Run Intra-dataset Clustering
Binarize and LSI
These functions are taken from the mCG-5Kb clustering, which is very similar to the snATAC analysis
You may also use the snATAC analysis packages (e.g., snapatac, signac) to process the snATAC data and get the PCs and cluster labels
binarize_matrix(adata)

filter_regions(adata, hypo_cutoff=300)

black_list_path = None  # already removed black list regions
if black_list_path is not None:
    remove_black_list_region(adata, black_list_path, f=0.1)
adata
AnnData object with n_obs × n_vars = 43361 × 185431
    obs: 'MajorType', 'SubType'
lsi(adata, algorithm='arpack', obsm='X_pca')

# choose significant components
n_components = significant_pc_test(adata)
33 components passed P cutoff of 0.1.
Changing adata.obsm['X_pca'] from shape (43361, 100) to (43361, 33)
# remove first PC as it is highly correlated with coverage
adata.obsm['X_pca'] = adata.obsm['X_pca'][:, 1:]
n_components -= 1
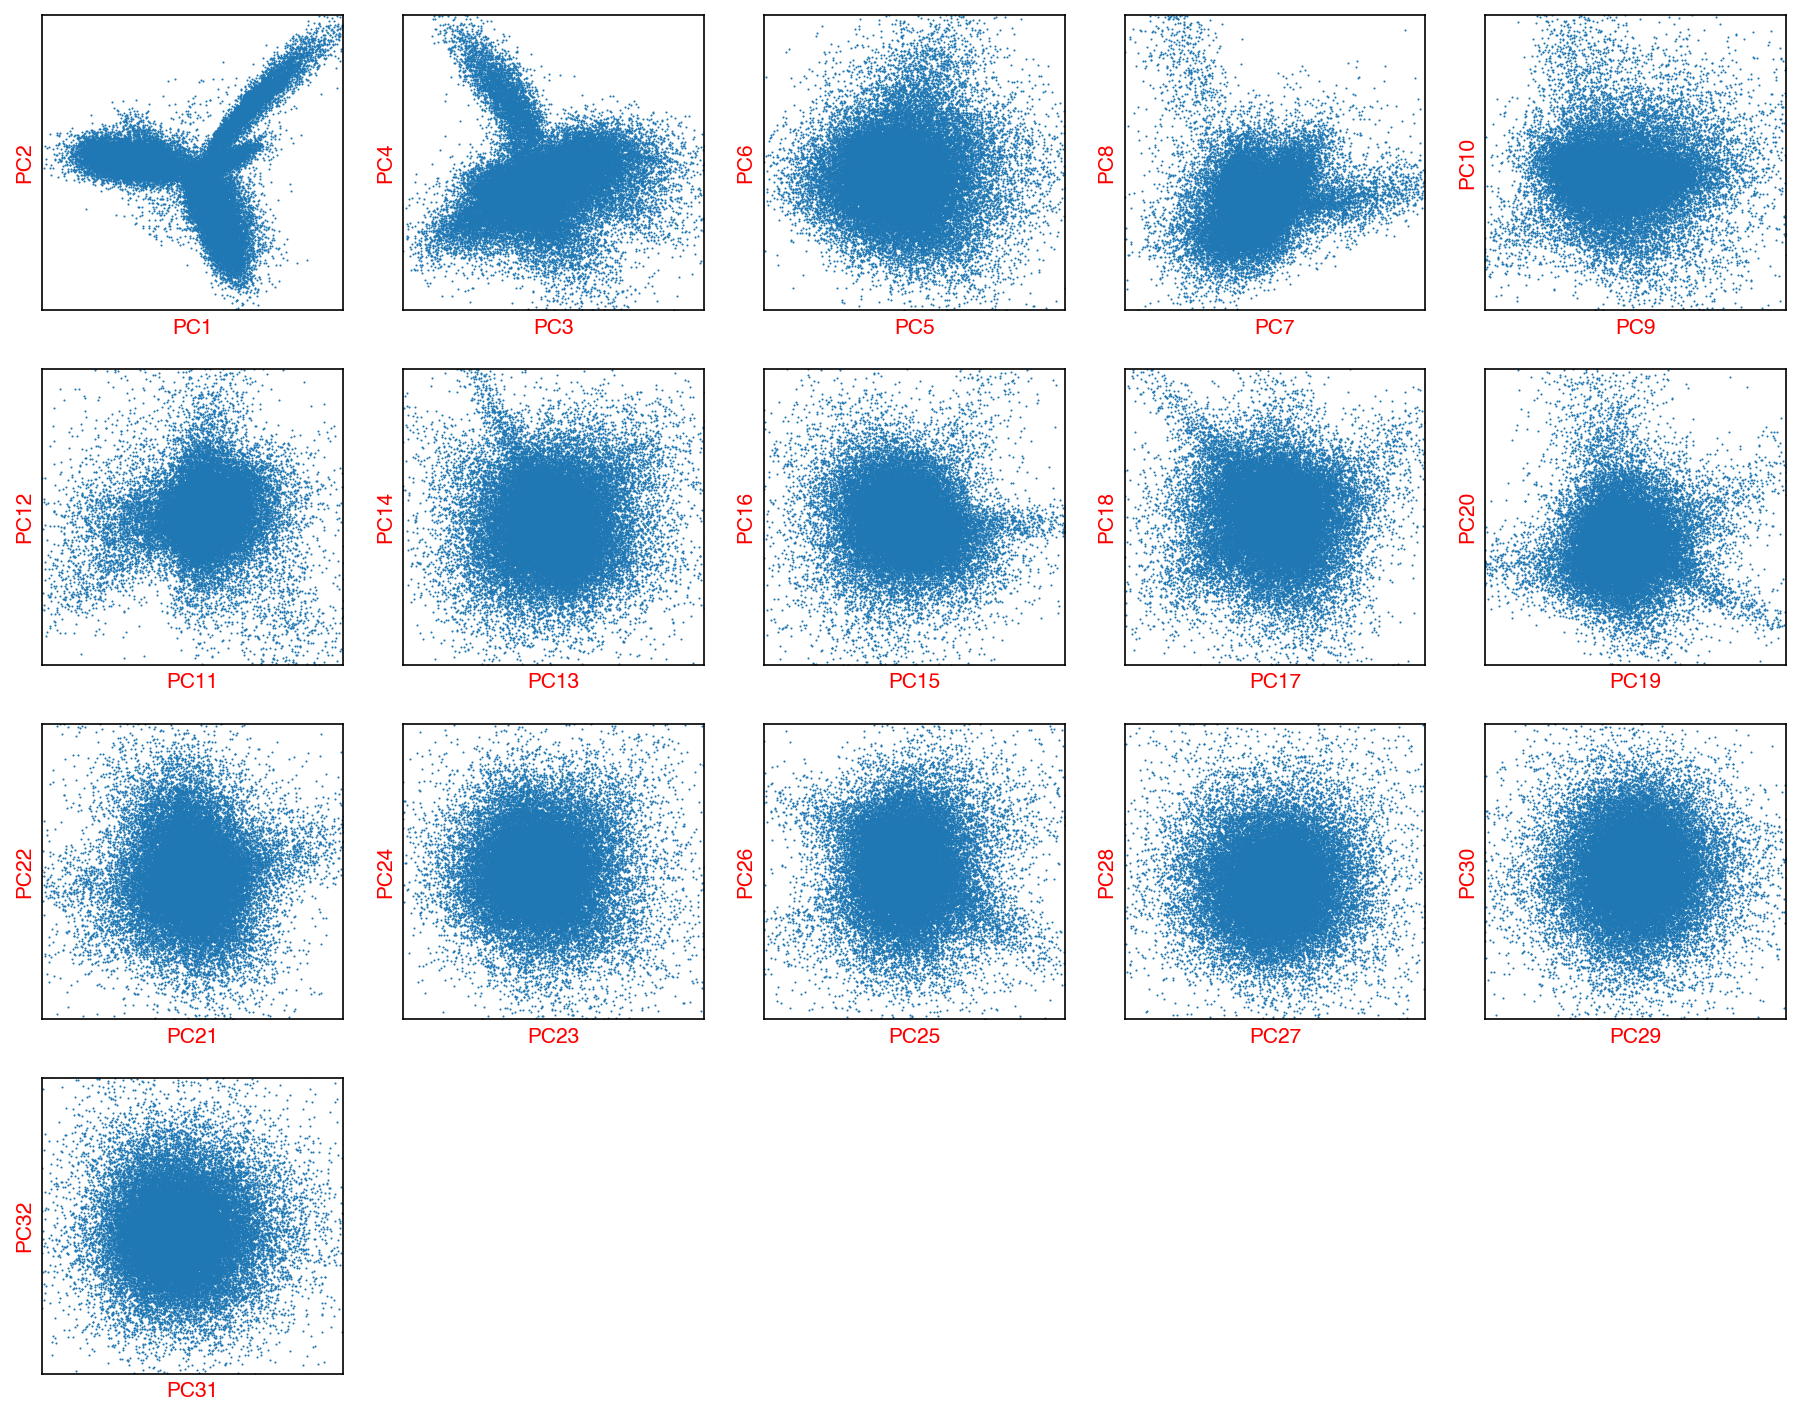
Check the PCs
fig, axes = plot_decomp_scatters(adata,
                                 n_components=n_components,
                                 hue=None,
                                 hue_quantile=(0.25, 0.75),
                                 nrows=5,
                                 ncols=5)
Red axis labels are used PCs
Leiden clustering
def dump_embedding(adata, name, n_dim=2):
    # put manifold coordinates into adata.obs
    for i in range(n_dim):
        adata.obs[f'{name}_{i}'] = adata.obsm[f'X_{name}'][:, i]
    return
sc.pp.neighbors(adata)
sc.tl.leiden(adata, resolution=1)
sc.tl.umap(adata)
dump_embedding(adata, 'umap')
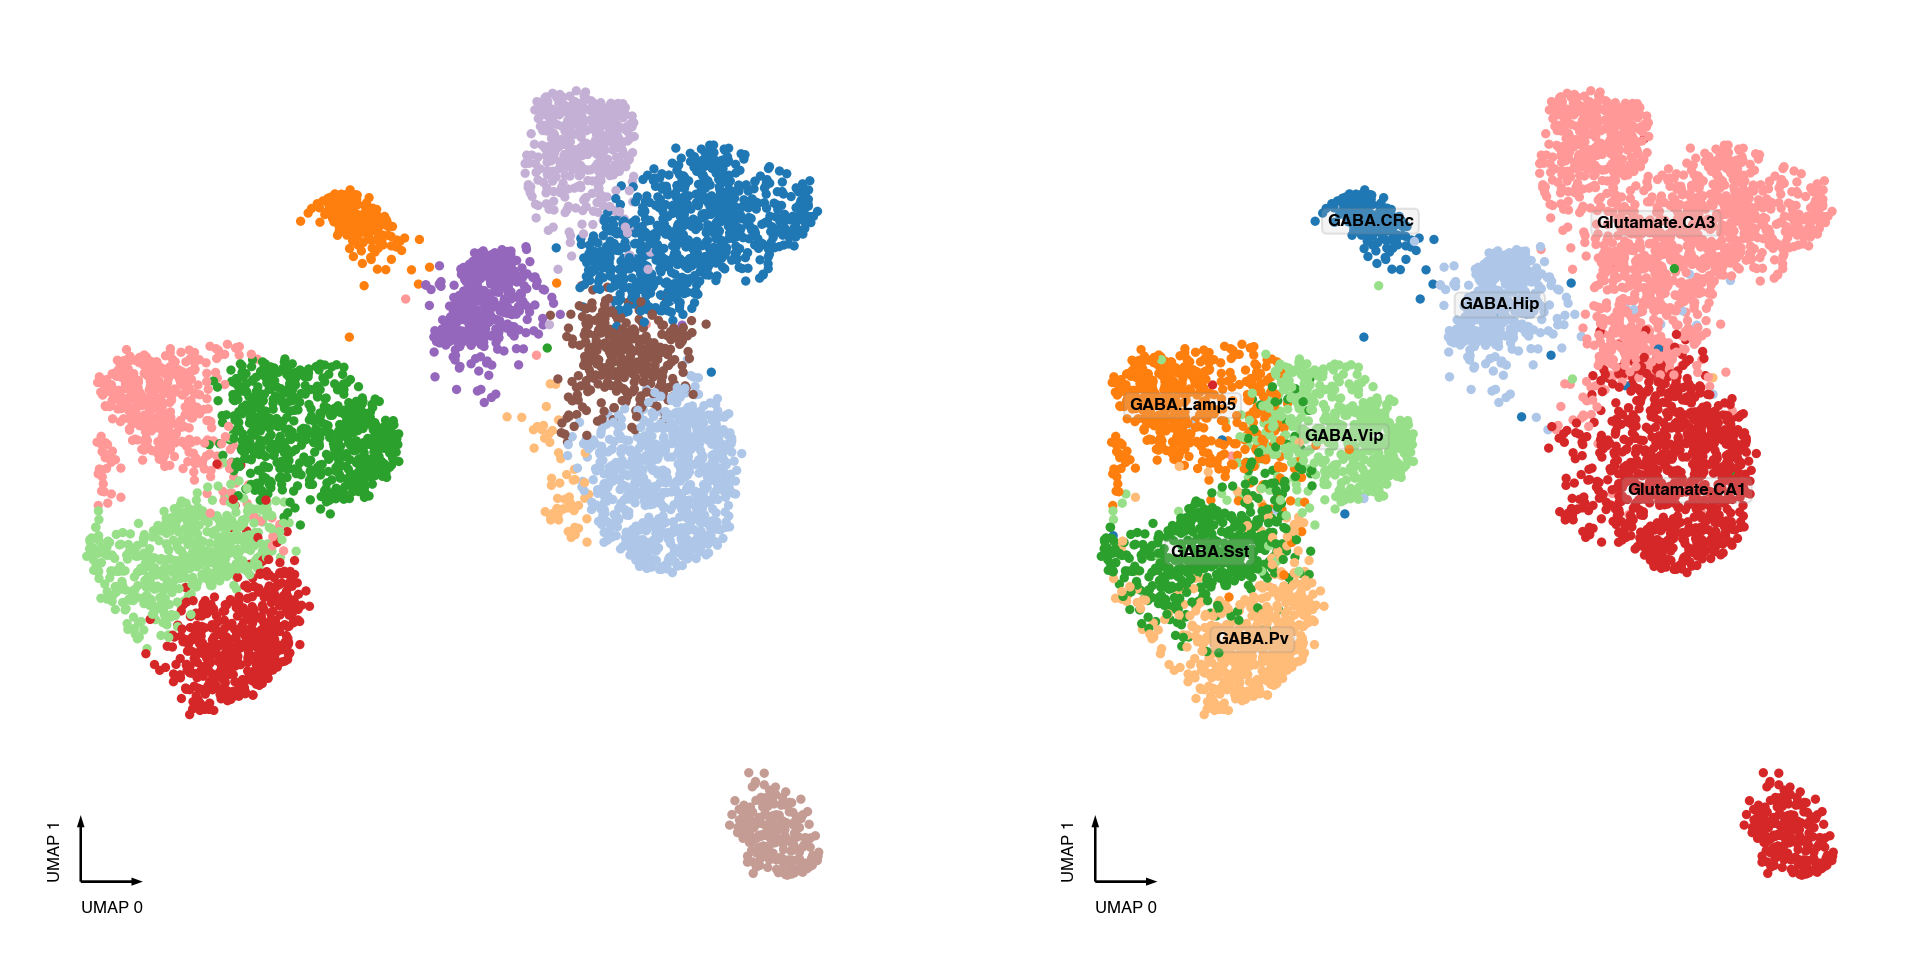
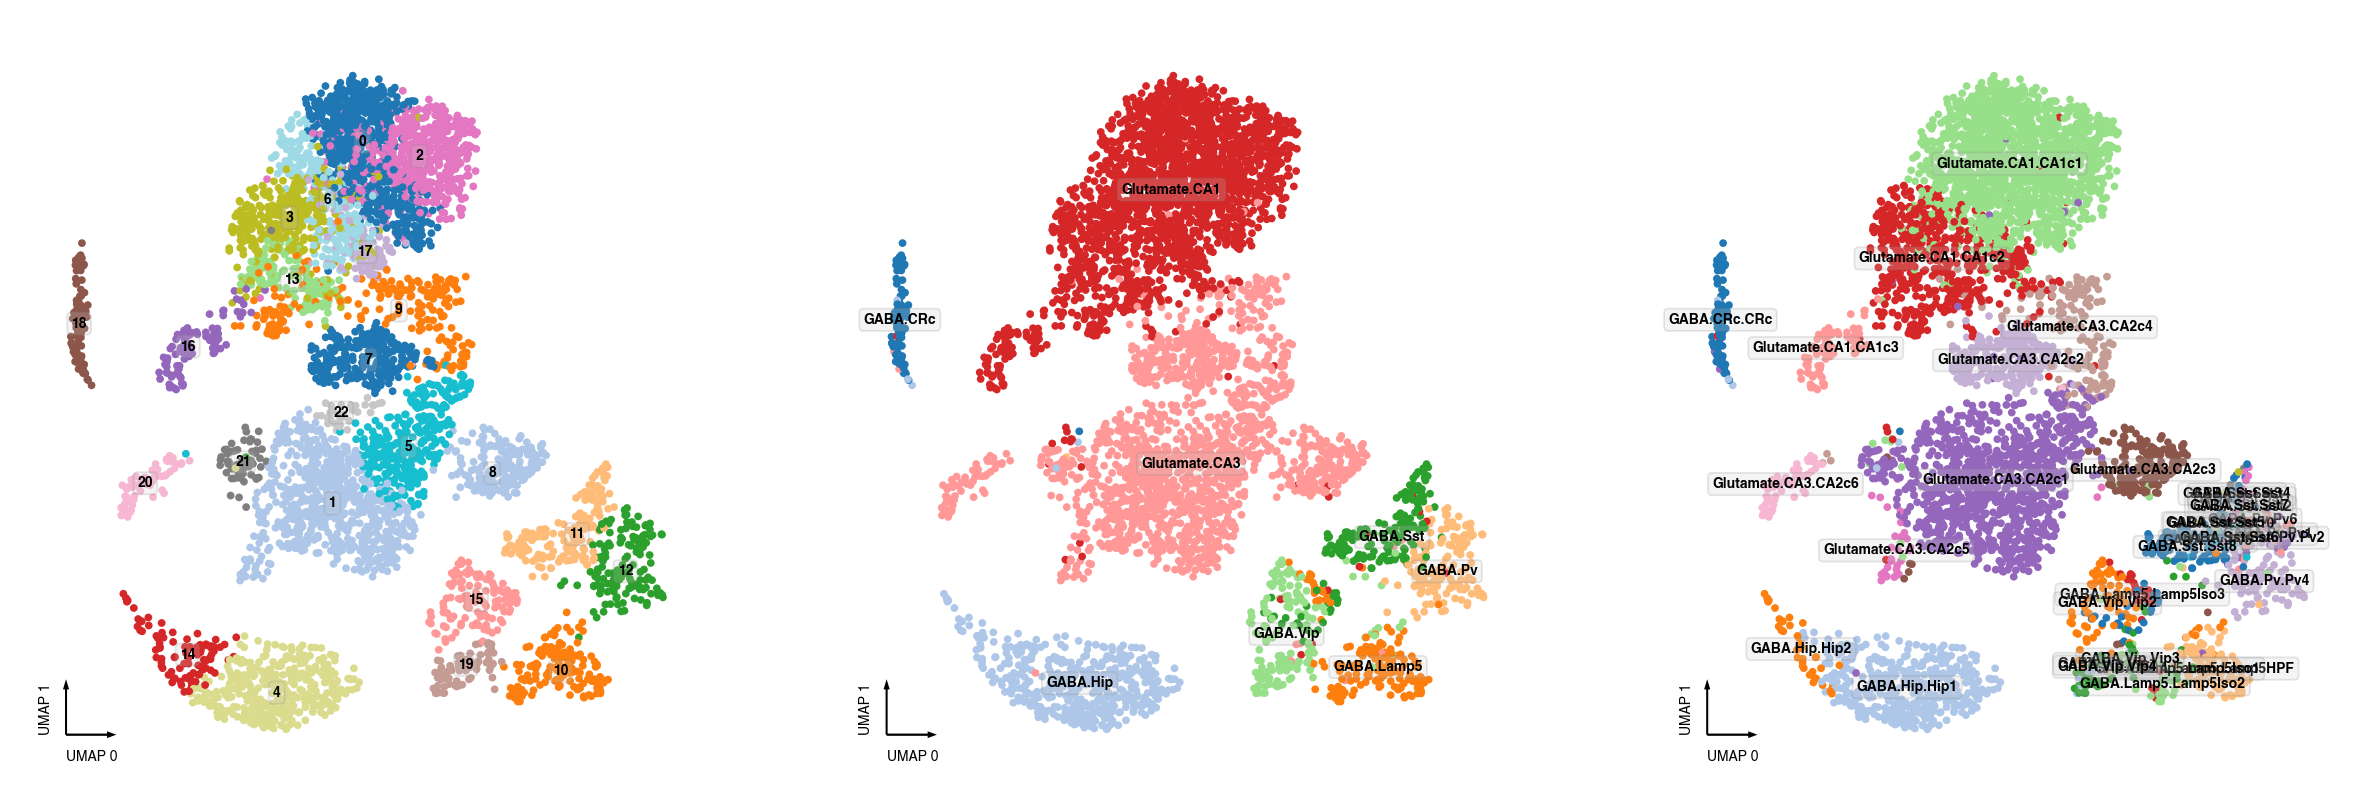
fig, axes = plt.subplots(figsize=(12, 4), dpi=250, ncols=3)
adata.obs['SubType'] = adata.obs['SubType'].astype(str)
adata.obs['MajorType'] = adata.obs['MajorType'].astype(str)

ax = axes[0]
_ = categorical_scatter(data=adata.obs,
                        ax=ax,
                        coord_base='umap',
                        hue='leiden',
                        palette='tab20',
                        text_anno='leiden')
ax = axes[1]
_ = categorical_scatter(data=adata.obs,
                        ax=ax,
                        coord_base='umap',
                        hue='MajorType',
                        palette='tab20',
                        text_anno='MajorType')
ax = axes[2]
_ = categorical_scatter(data=adata.obs,
                        ax=ax,
                        coord_base='umap',
                        hue='SubType',
                        palette='tab20',
                        text_anno='SubType')
Downsample and balance each cluster
In this step, we group the obsm matrix by cluster_col, and run K-means on each cluster’s matrix. For large clusters that have > cluster_size_cutoff number of cells, the K-means clustering is done iteratively until all the clusters are smaller than max_pseudo_size. The reducing function aggregate_func can be:
sum: if theadata.Xis raw counts matrix and you want to add them together to form a pseudo-cellmean: take the mean of each K-means cell groupmedian: take the mean of each K-means cell groupdownsample: randomly select only one cell from the K-means cell group.
Notes:
Here I used the cluster labels generated by the data provider, which is more granular than the leiden clusters because these labels are calculated with other brain datasets in a iterative process.
If such labels don’t exist, you may use just the leiden clusters above
gene_adata = anndata.read_h5ad('../../input/snATAC.gene.Neuron.h5ad')
We use 5Kb bin matrix to calculate PCs and identify cell groups
We use gene matrix to generate pseudo-cells in order to integrate with other modalities.
# add bins PCs to gene adata
gene_adata.obsm['X_pca'] = adata.obsm['X_pca']
gene_adata.obs['SubType'] = adata.obs['SubType']
gene_adata.obs['MajorType'] = adata.obs['MajorType']
from ALLCools.pseudo_cell import generate_pseudo_cells_kmeans

pseudo_adata = generate_pseudo_cells_kmeans(gene_adata,
                                            cluster_col='SubType',
                                            obsm='X_pca',
                                            cluster_size_cutoff=100,
                                            max_pseudo_size=50,
                                            aggregate_func='downsample')

pseudo_adata
AnnData object with n_obs × n_vars = 5026 × 53278
    obs: 'n_cells', 'SubType'
Identify HVF for integration
# remove low cov gene
sc.pp.filter_genes(gene_adata, min_cells=int(gene_adata.shape[0] * 0.003))
sc.pp.normalize_per_cell(gene_adata)
sc.pp.log1p(gene_adata)
pseudo_adata = pseudo_adata[:, gene_adata.var_names]
sc.pp.normalize_per_cell(pseudo_adata)
sc.pp.log1p(pseudo_adata)
Trying to set attribute `.obs` of view, copying.
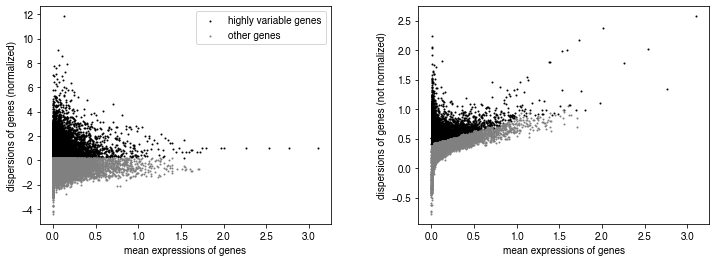
# identify highly variable genes on pseudo_adata
sc.pp.highly_variable_genes(pseudo_adata, n_top_genes=10000, n_bins=100)
sc.pl.highly_variable_genes(pseudo_adata)
test_adata = pseudo_adata[:, pseudo_adata.var['highly_variable']].copy()
Save AnnData
gene_adata.write_h5ad(f'ATAC.TotalAdata.norm_log1p.h5ad')
... storing 'MajorType' as categorical
... storing 'SubType' as categorical
... storing 'pseudo_group' as categorical
pseudo_adata.write_h5ad(f'ATAC.PseudoCellAdata.norm_log1p.h5ad')
... storing 'SubType' as categorical
Run a test clustering with HVFs
Run a test clustering within this dataset to check how diverse the HVF matrix is.
sc.pp.scale(test_adata)
sc.tl.pca(test_adata)
sc.pp.neighbors(test_adata)
sc.tl.umap(test_adata)
sc.tl.leiden(test_adata)
test_adata.obs['group'] = test_adata.obs_names.map(lambda i: '.'.join(i.split('.')[:2]))
fig, axes = plt.subplots(figsize=(8, 4), dpi=300, ncols=2)
ax = axes[0]
categorical_scatter(ax=ax, data=test_adata, hue='leiden', palette='tab20')
ax = axes[1]
test_adata.obs['MajorType'] = test_adata.obs['SubType'].apply(
    lambda i: '.'.join(i.split('.')[:2]))
categorical_scatter(ax=ax, data=test_adata, hue='MajorType', palette='tab20', text_anno='MajorType')