Consensus Clustering
Contents
Consensus Clustering
Purpose
The purpose of this step is to run consensus clustering.
Input
Cell-by-components matrix from the decompusition analysis.
Output
Adata file with cluster annotated.
Import
import anndata
import pandas as pd
import seaborn as sns
import matplotlib.pyplot as plt

from ALLCools.clustering import ConsensusClustering, Dendrogram, get_pc_centers
from ALLCools.plot import *
Parameters
# clustering name
clustering_name = 'L1'

# input data
cell_meta_path = './CellMetadata.PassQC.csv.gz'
adata_path = './adata.with_coords.h5ad'
coord_base = 'tsne'

# ConsensusClustering
# Important factores
n_neighbors = 25
leiden_resolution = 1
# this parameter is the final target that limit the total number of clusters
# Higher accuracy means more conservative clustering results and less number of clusters
target_accuracy = 0.94
min_cluster_size = 20

# Other ConsensusClustering parameters
metric = 'euclidean'
consensus_rate = 0.7
leiden_repeats = 500
random_state = 0
train_frac = 0.5
train_max_n = 500
max_iter = 50
n_jobs = 40

# Dendrogram via Multiscale Bootstrap Resampling
nboot = 10000
method_dist = 'correlation'
method_hclust = 'average'

plot_type = 'static'
Load Data
cell_meta = pd.read_csv(cell_meta_path, index_col=0)
adata = anndata.read_h5ad(adata_path)
Consensus Clustering
cc = ConsensusClustering(model=None,
                         n_neighbors=n_neighbors,
                         metric=metric,
                         min_cluster_size=min_cluster_size,
                         leiden_repeats=leiden_repeats,
                         leiden_resolution=leiden_resolution,
                         consensus_rate=consensus_rate,
                         random_state=random_state,
                         train_frac=train_frac,
                         train_max_n=train_max_n,
                         max_iter=max_iter,
                         n_jobs=n_jobs,
                         target_accuracy=target_accuracy)
if 'X_pca' not in adata.obsm:
    raise KeyError(
        'X_pca do not exist in the adata file, run PCA first before clustering.'
    )
cc.fit_predict(adata.obsm['X_pca'])
Computing nearest neighbor graph
Computing multiple clustering with different random seeds
Repeating leiden clustering 500 times
Found 27 - 33 clusters, mean 29.6, std 1.13
Summarizing multiple clustering results
16799 cells assigned to 49 raw clusters
186 cells are multi-leiden outliers
=== Start supervise model training and cluster merging ===
=== iteration 1 ===
49 non-outlier labels
Balanced accuracy on the training set: 0.923
Balanced accuracy on the hold-out set: 0.887
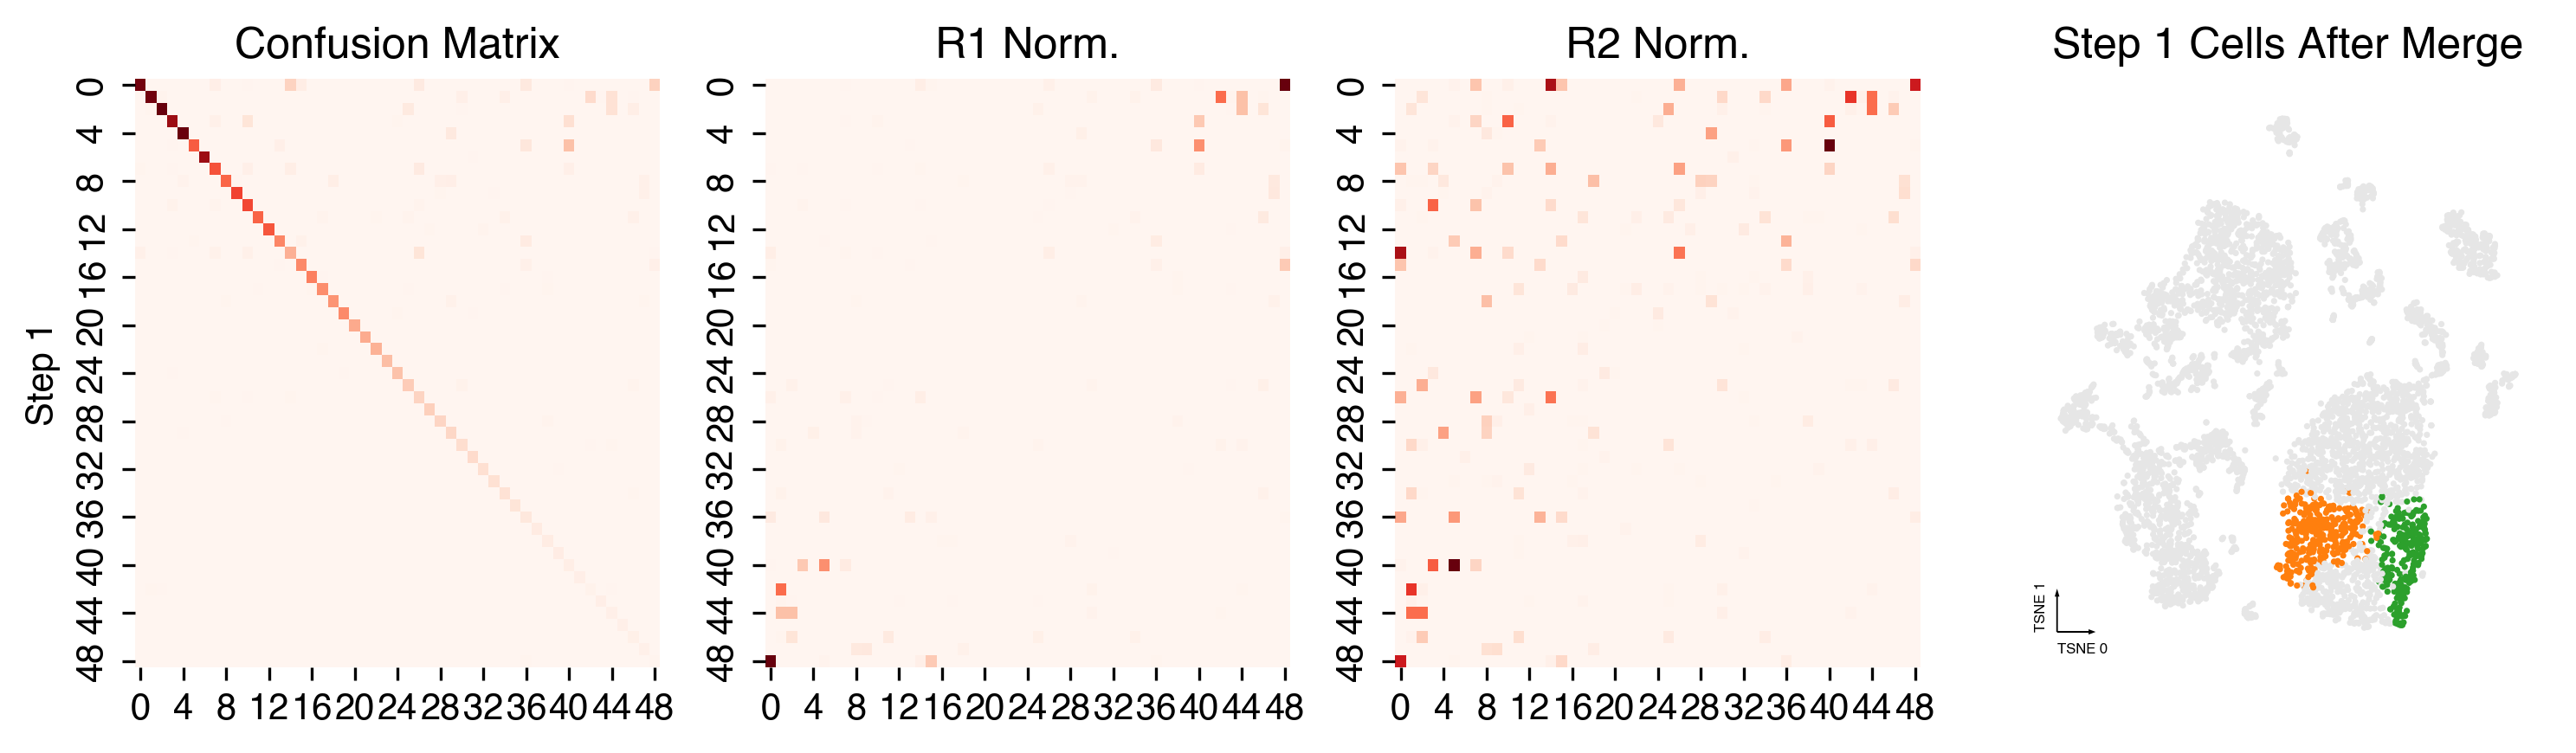
Merging 2 clusters.
=== iteration 2 ===
47 non-outlier labels
Balanced accuracy on the training set: 0.932
Balanced accuracy on the hold-out set: 0.904
Merging 3 clusters.
=== iteration 3 ===
44 non-outlier labels
Balanced accuracy on the training set: 0.941
Balanced accuracy on the hold-out set: 0.924
Merging 1 clusters.
=== iteration 4 ===
43 non-outlier labels
Balanced accuracy on the training set: 0.946
Balanced accuracy on the hold-out set: 0.924
Merging 2 clusters.
=== iteration 5 ===
41 non-outlier labels
Balanced accuracy on the training set: 0.952
Balanced accuracy on the hold-out set: 0.941
Stop iteration because current accuracy 0.941 > target accuracy 0.940.
=== Assign final labels ===
Assigned all the multi-leiden clustering outliers into clusters using the prediction model from final clustering version.
Final ten-fold CV Accuracy on all the cells: 0.937
cc.plot_merge_process(plot_size=3)
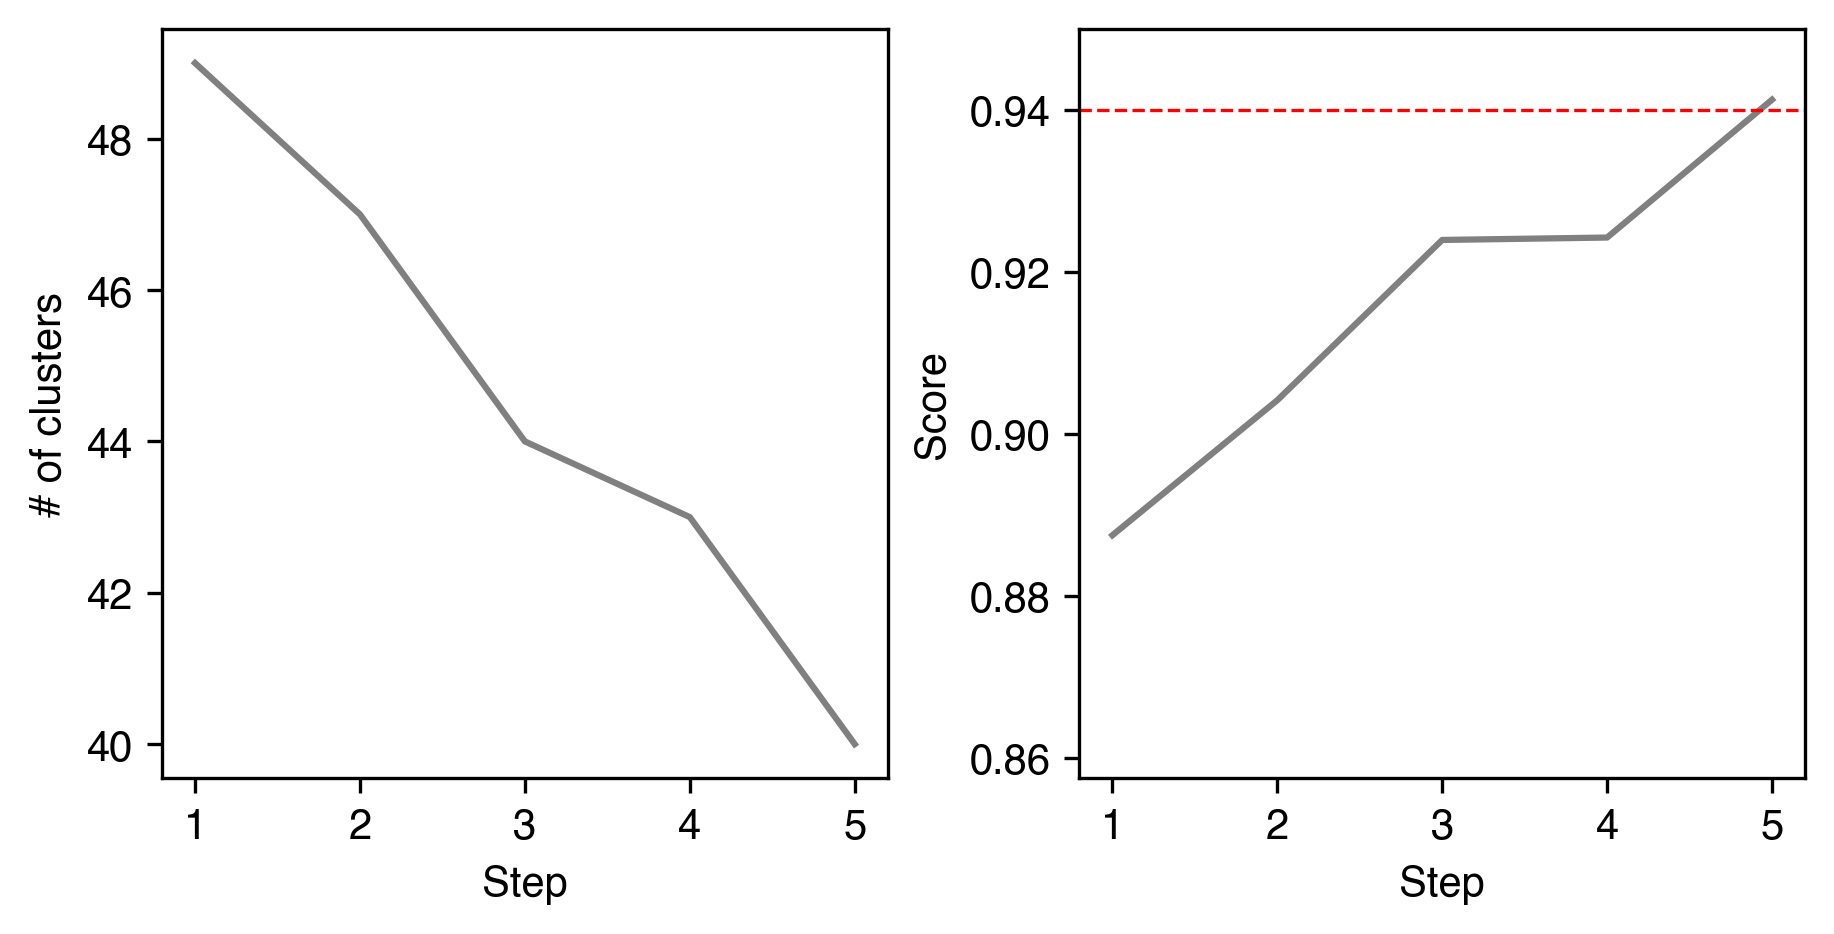
Plot ConsensusClustering Details
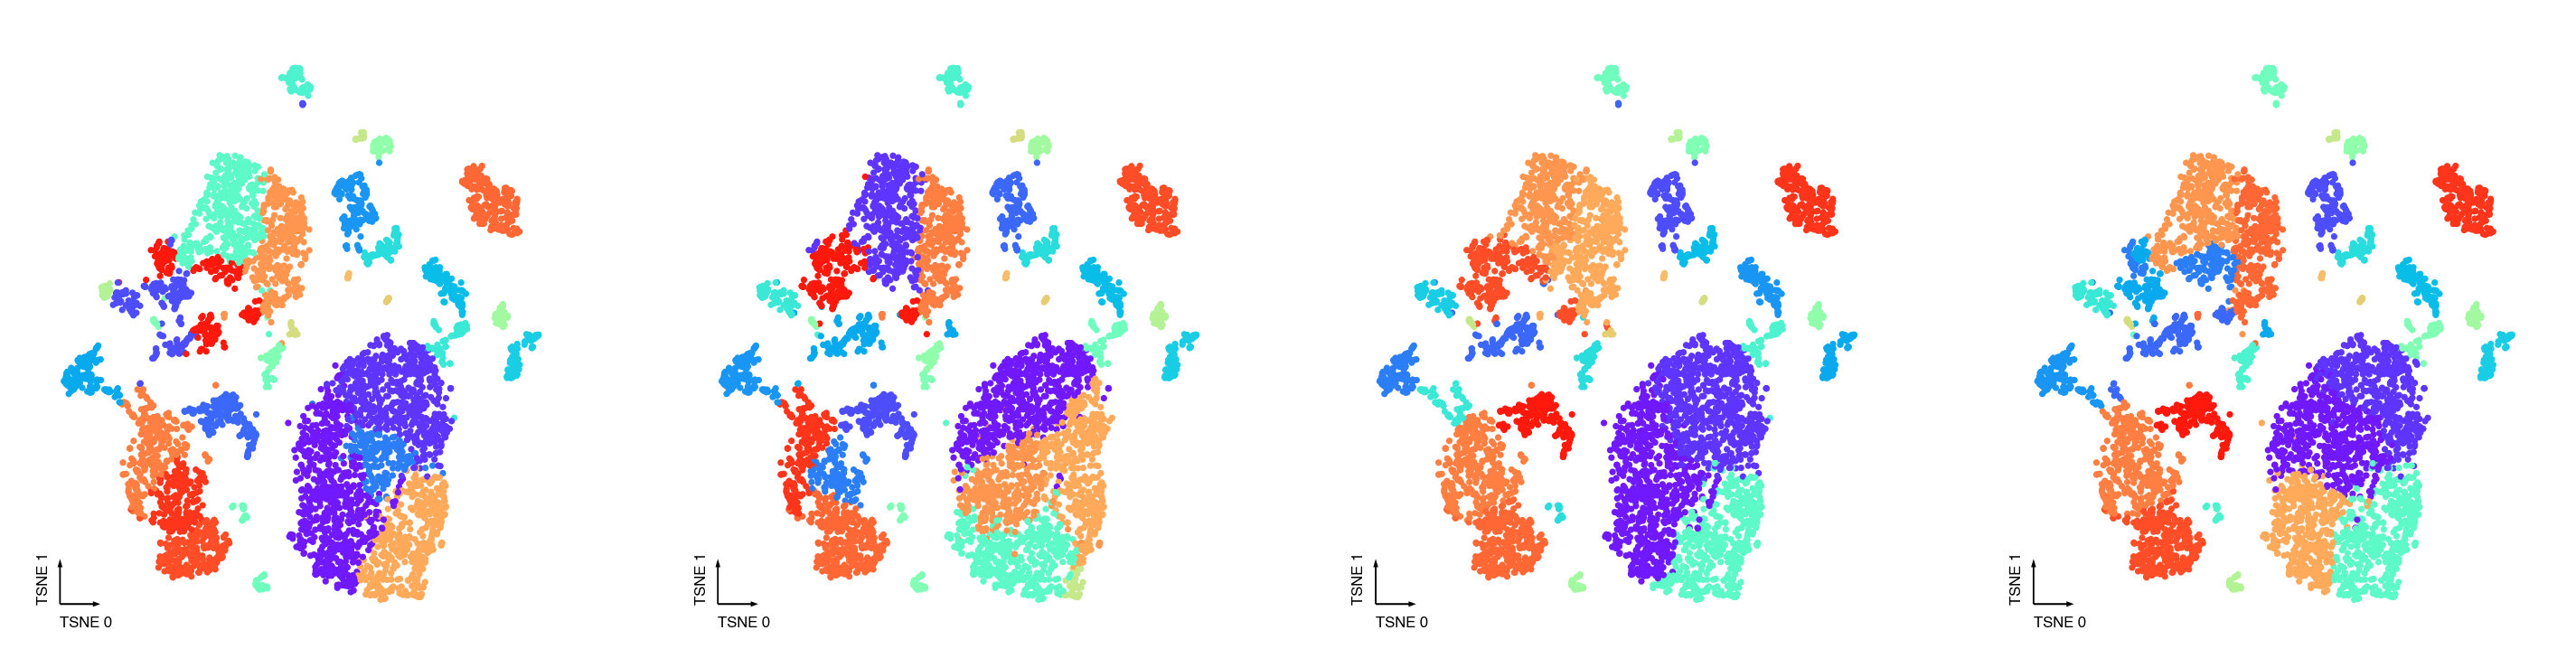
Individual Leiden runs with different random states
Check the randomness of individual leiden runs.
adata.obs[f'{coord_base}_0'] = adata.obsm[f'X_{coord_base}'][:, 0]
adata.obs[f'{coord_base}_1'] = adata.obsm[f'X_{coord_base}'][:, 1]
fig, axes = cc.plot_leiden_cases(coord_data=adata.obs,
                                 coord_base=coord_base)
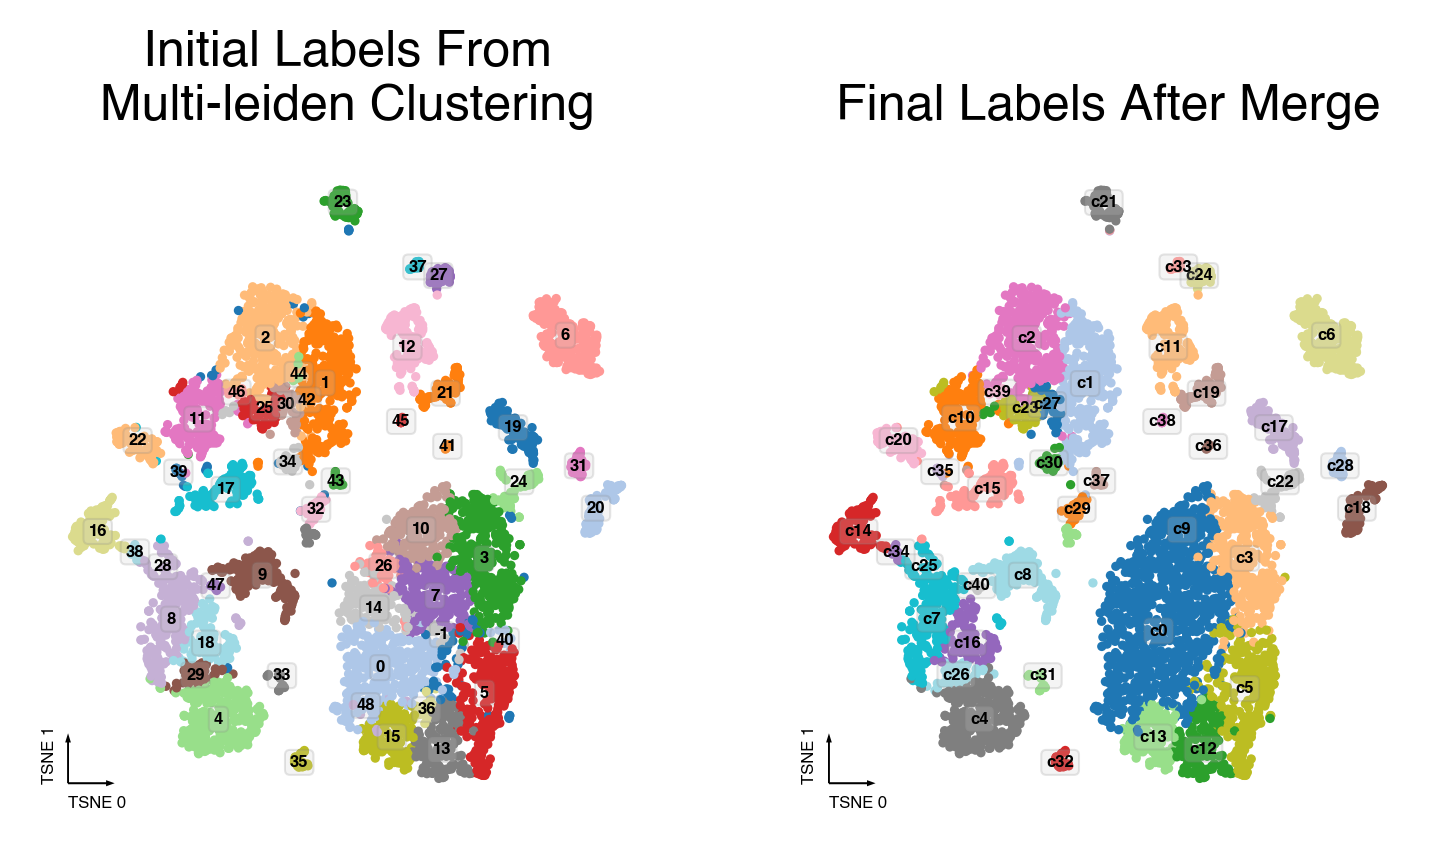
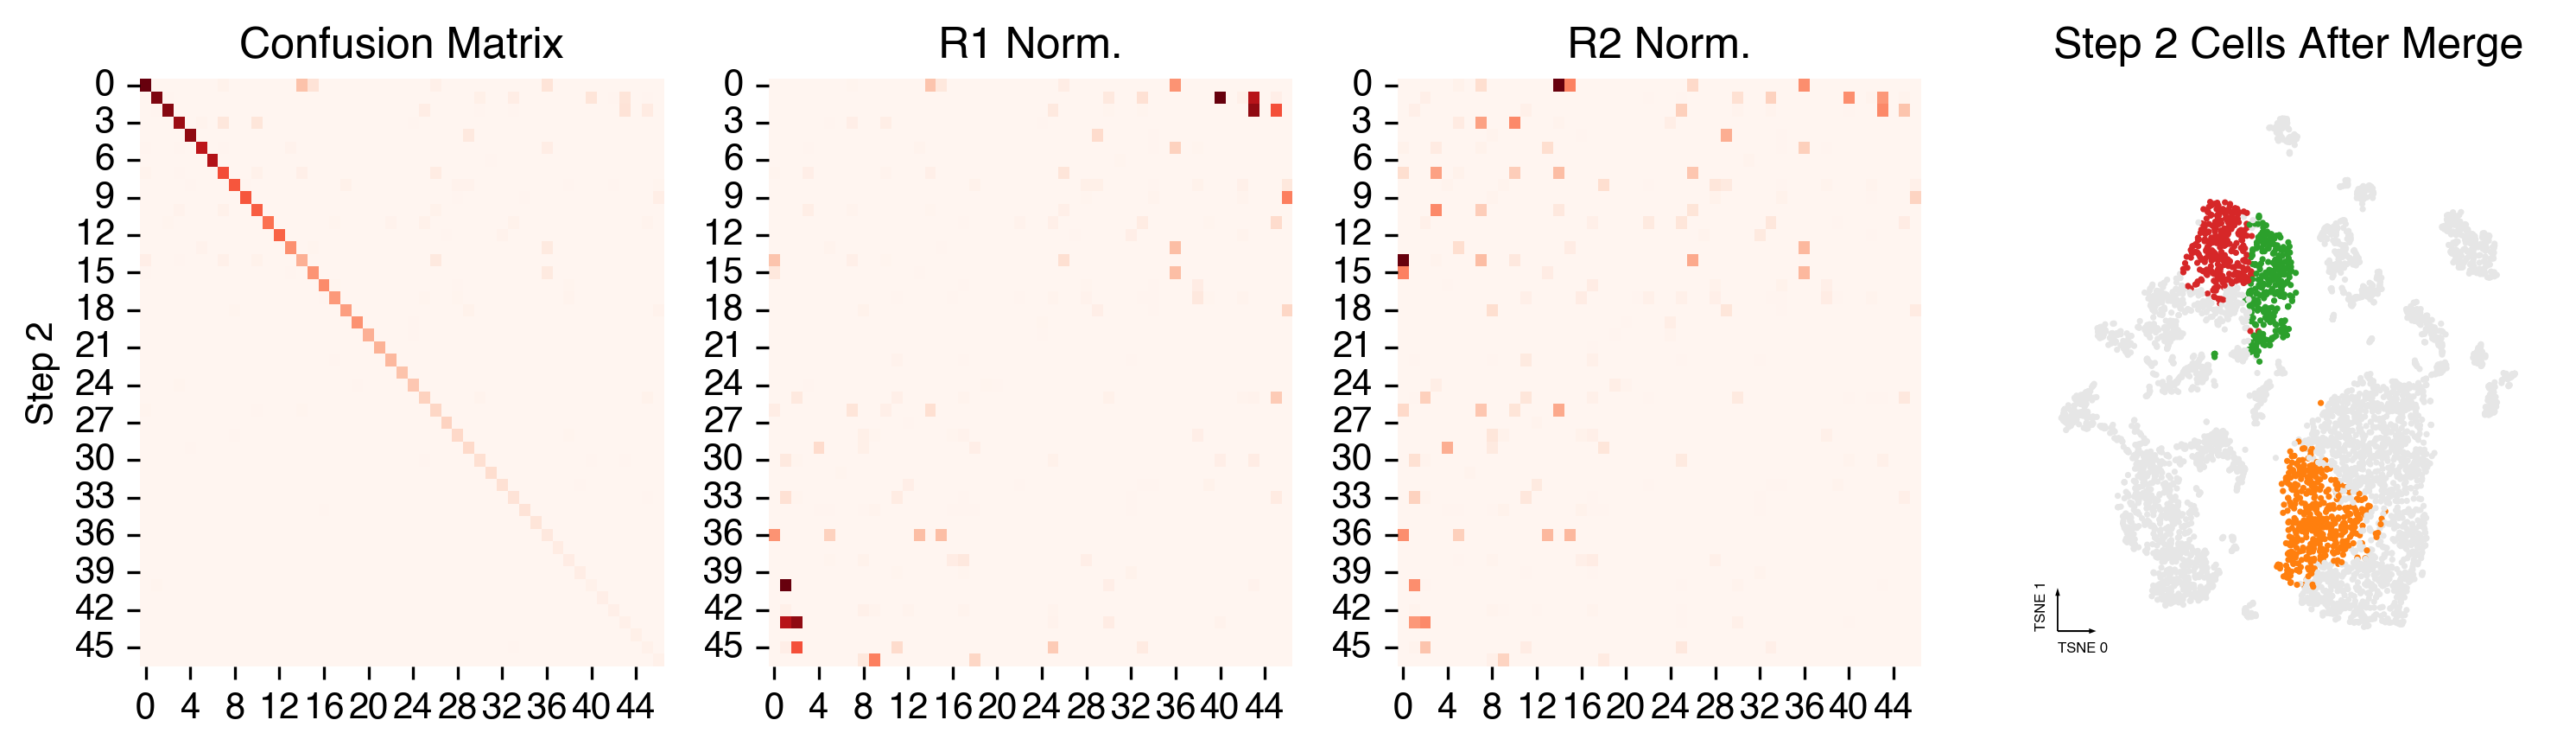
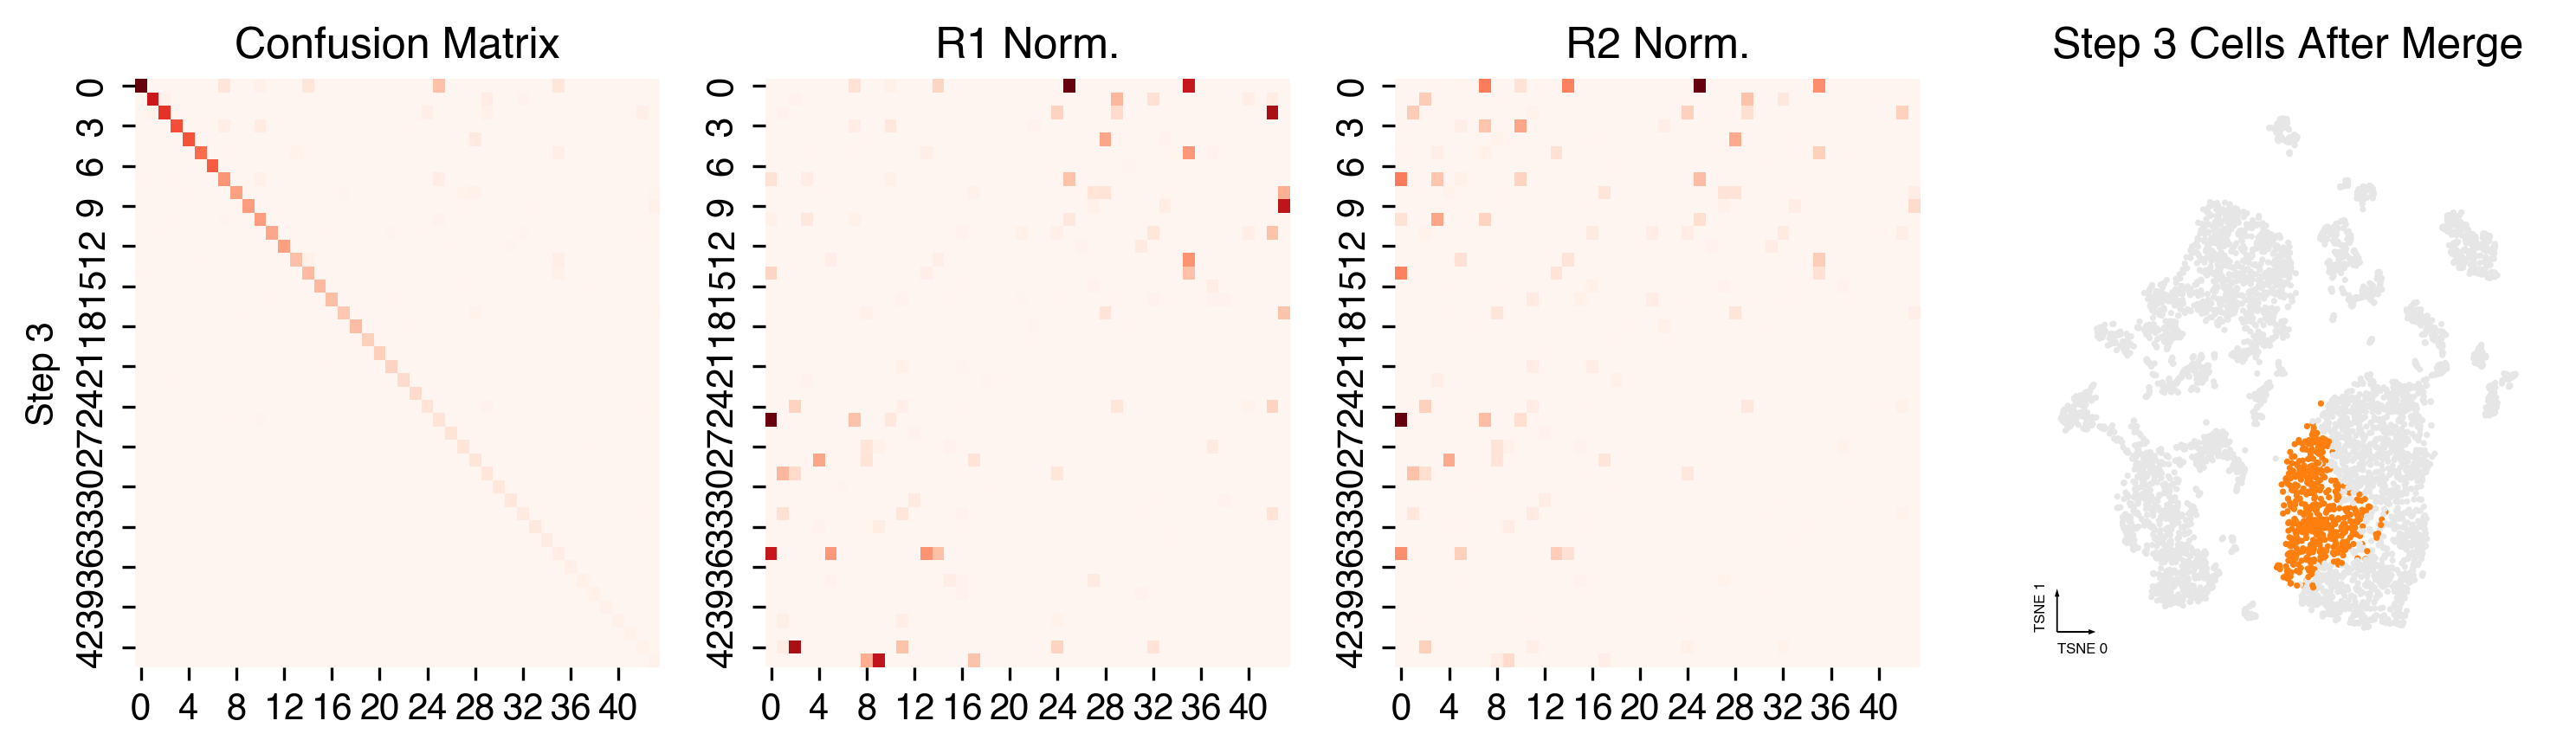
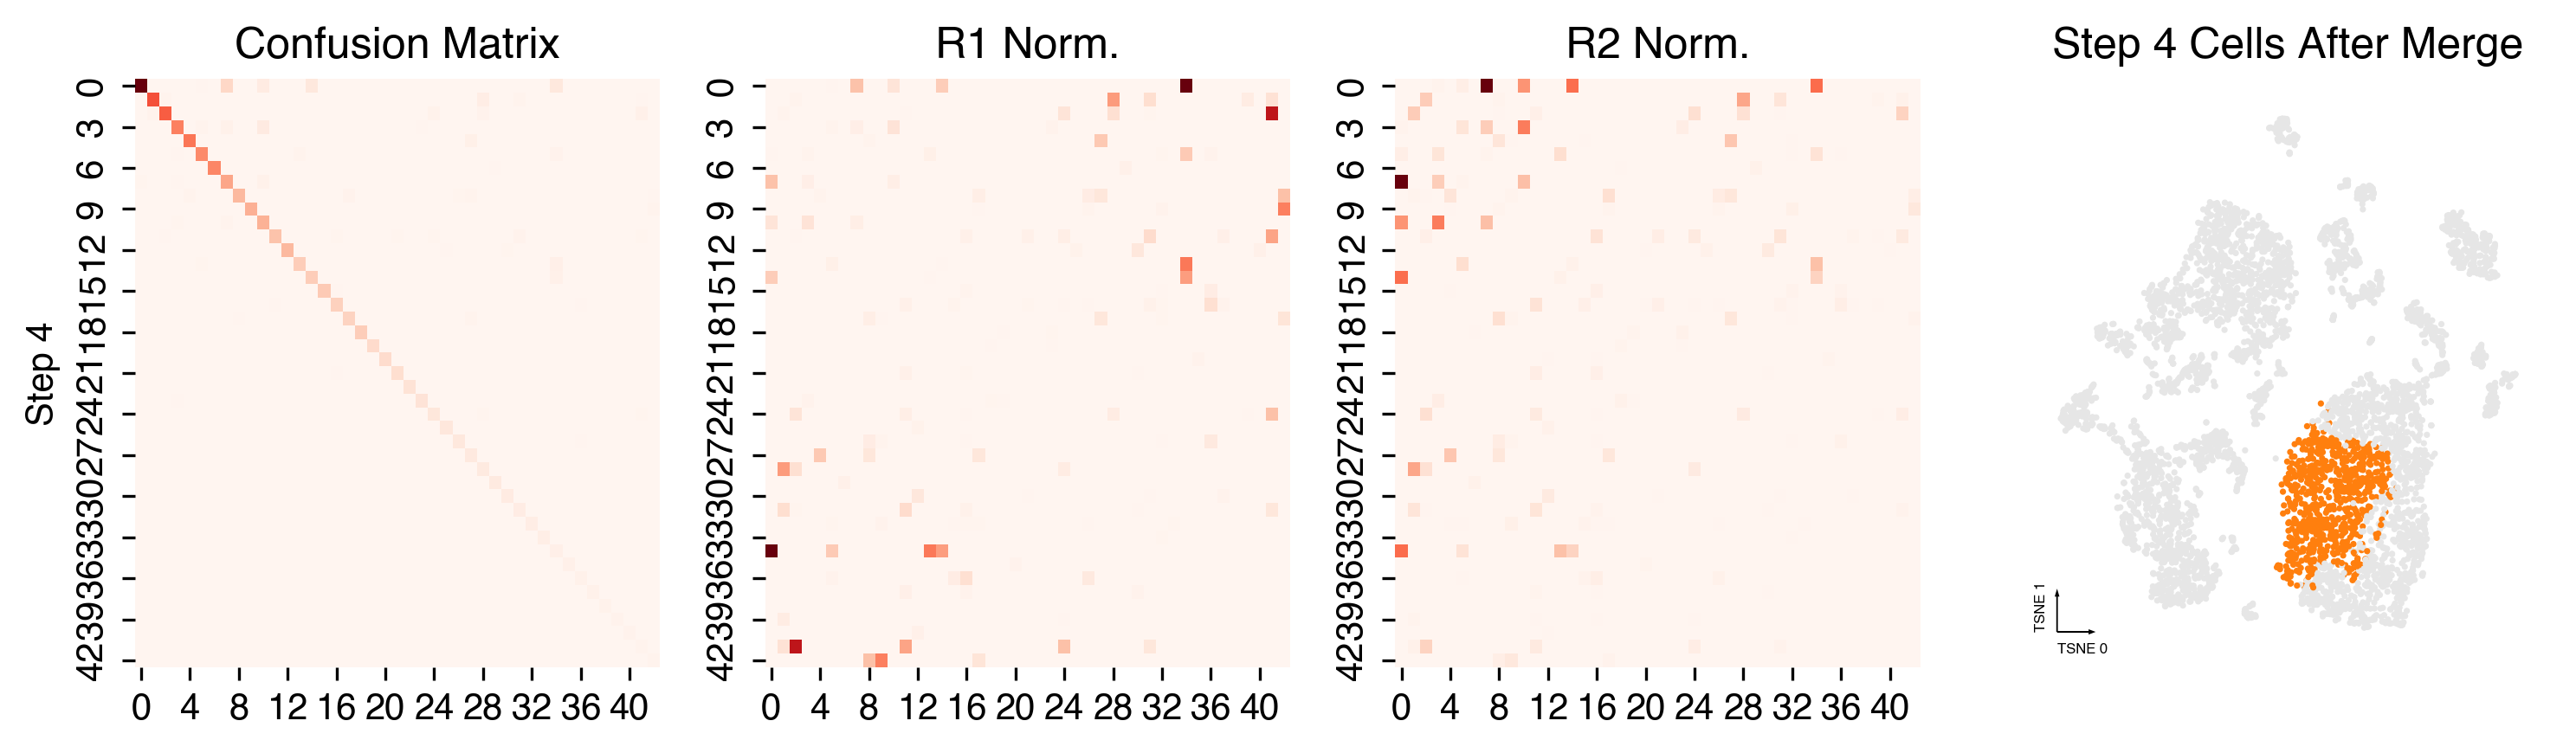
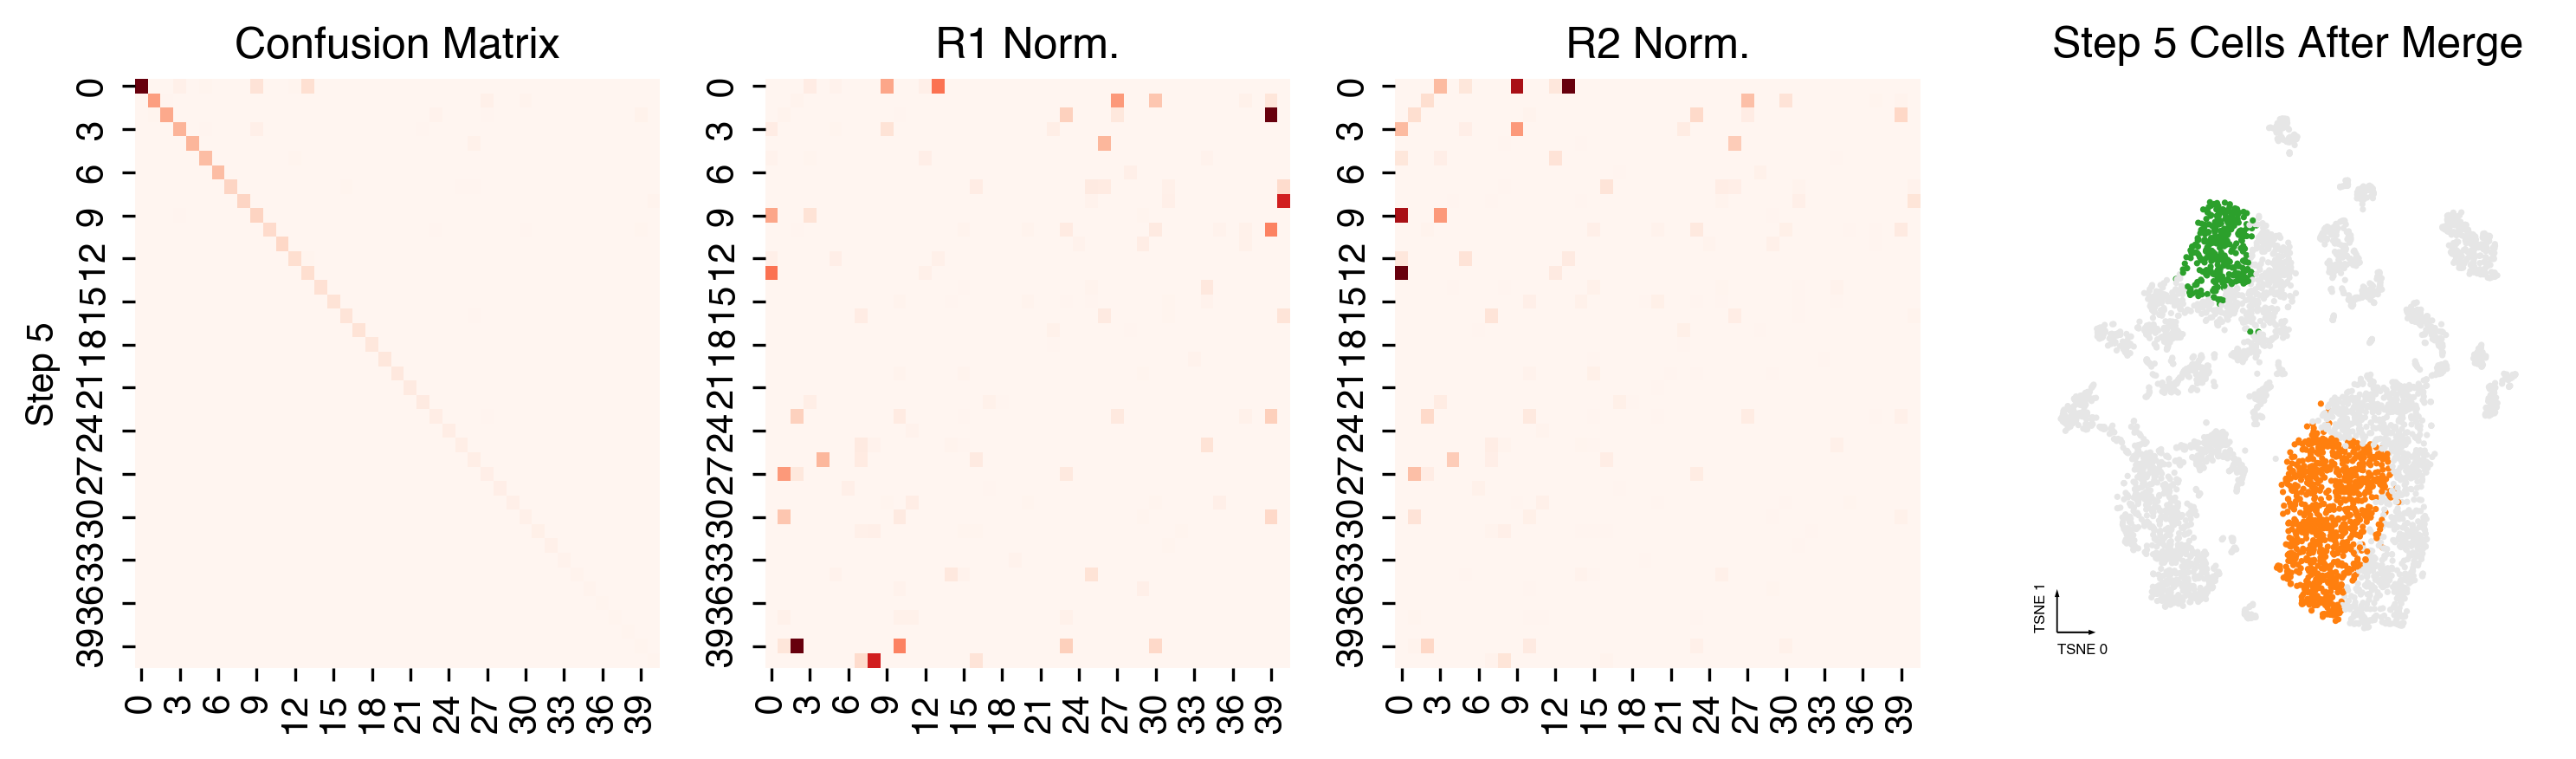
Merging steps
len(set(cc._multi_leiden_clusters)), len(set(cc.label))
(50, 41)
cc.plot_steps(coord_data=adata.obs, coord_base=coord_base)
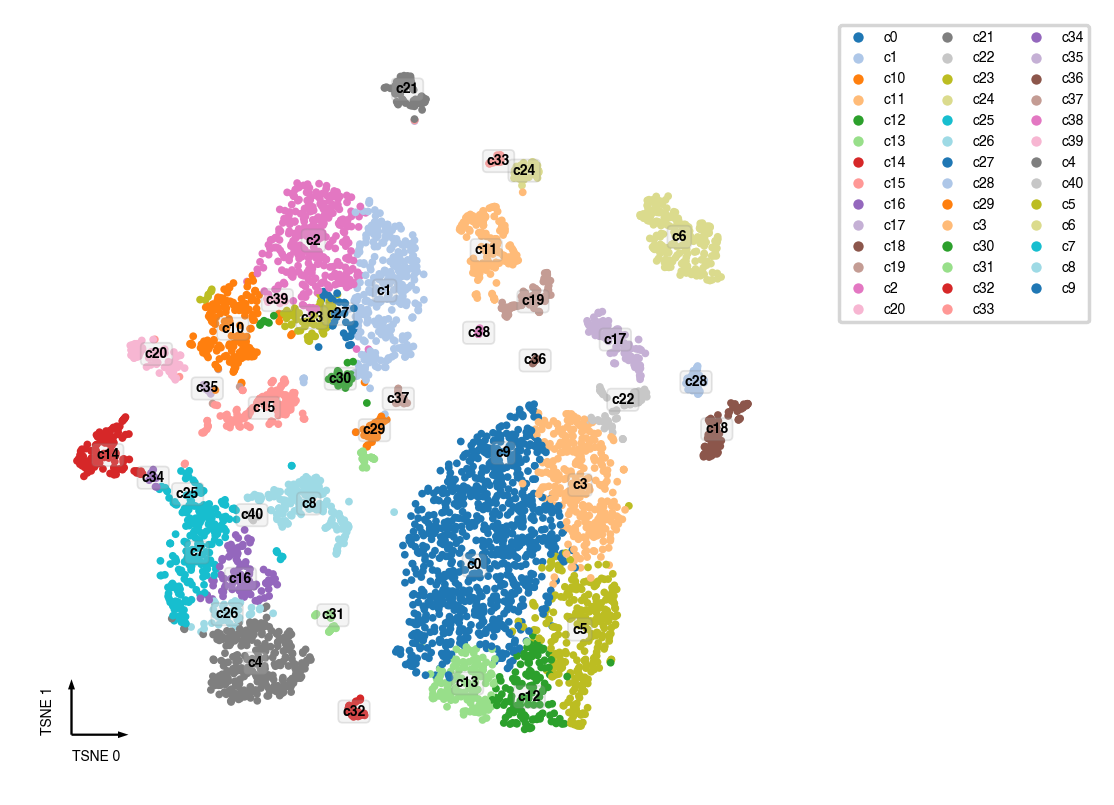
Plot Final Clustering Results
Cluster Lables
adata.obs[clustering_name] = cc.label

fig, ax = plt.subplots(figsize=(4, 4), dpi=250)
_ = categorical_scatter(data=adata,
                        ax=ax,
                        hue=clustering_name,
                        coord_base=coord_base,
                        palette='tab20',
                        text_anno=clustering_name,
                        show_legend=True)
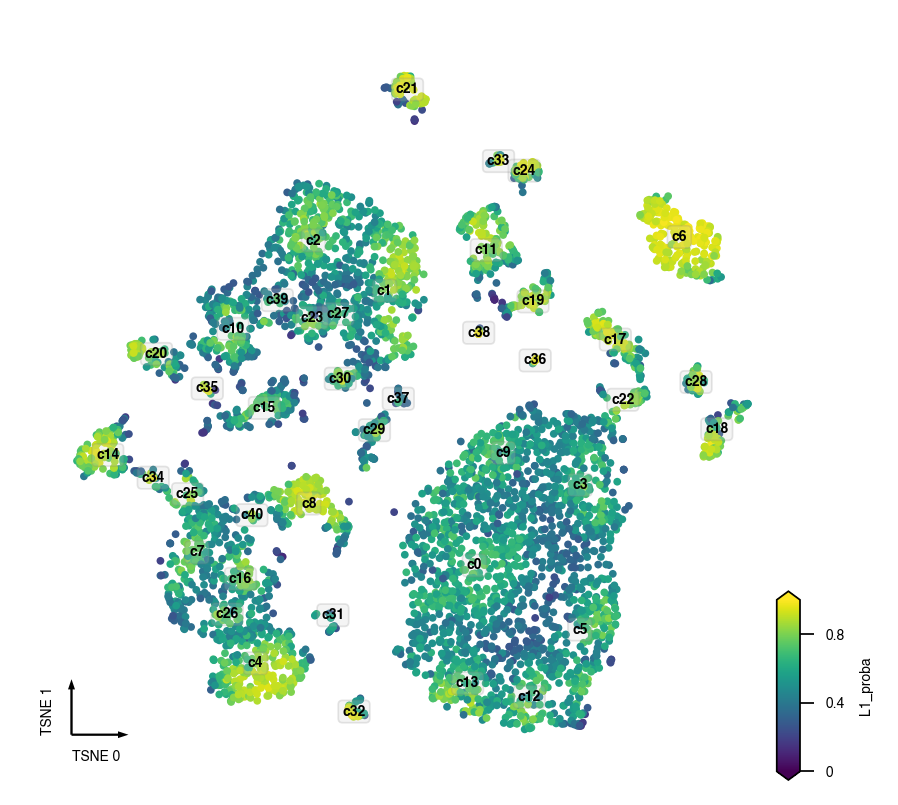
Final Prediction Probability
adata.obs[clustering_name + '_proba'] = cc.label_proba

fig, ax = plt.subplots(figsize=(4, 4), dpi=250)
_ = continuous_scatter(data=adata,
                       ax=ax,
                       hue_norm=(0, 1),
                       hue=clustering_name + '_proba',
                        text_anno=clustering_name,
                       coord_base=coord_base)
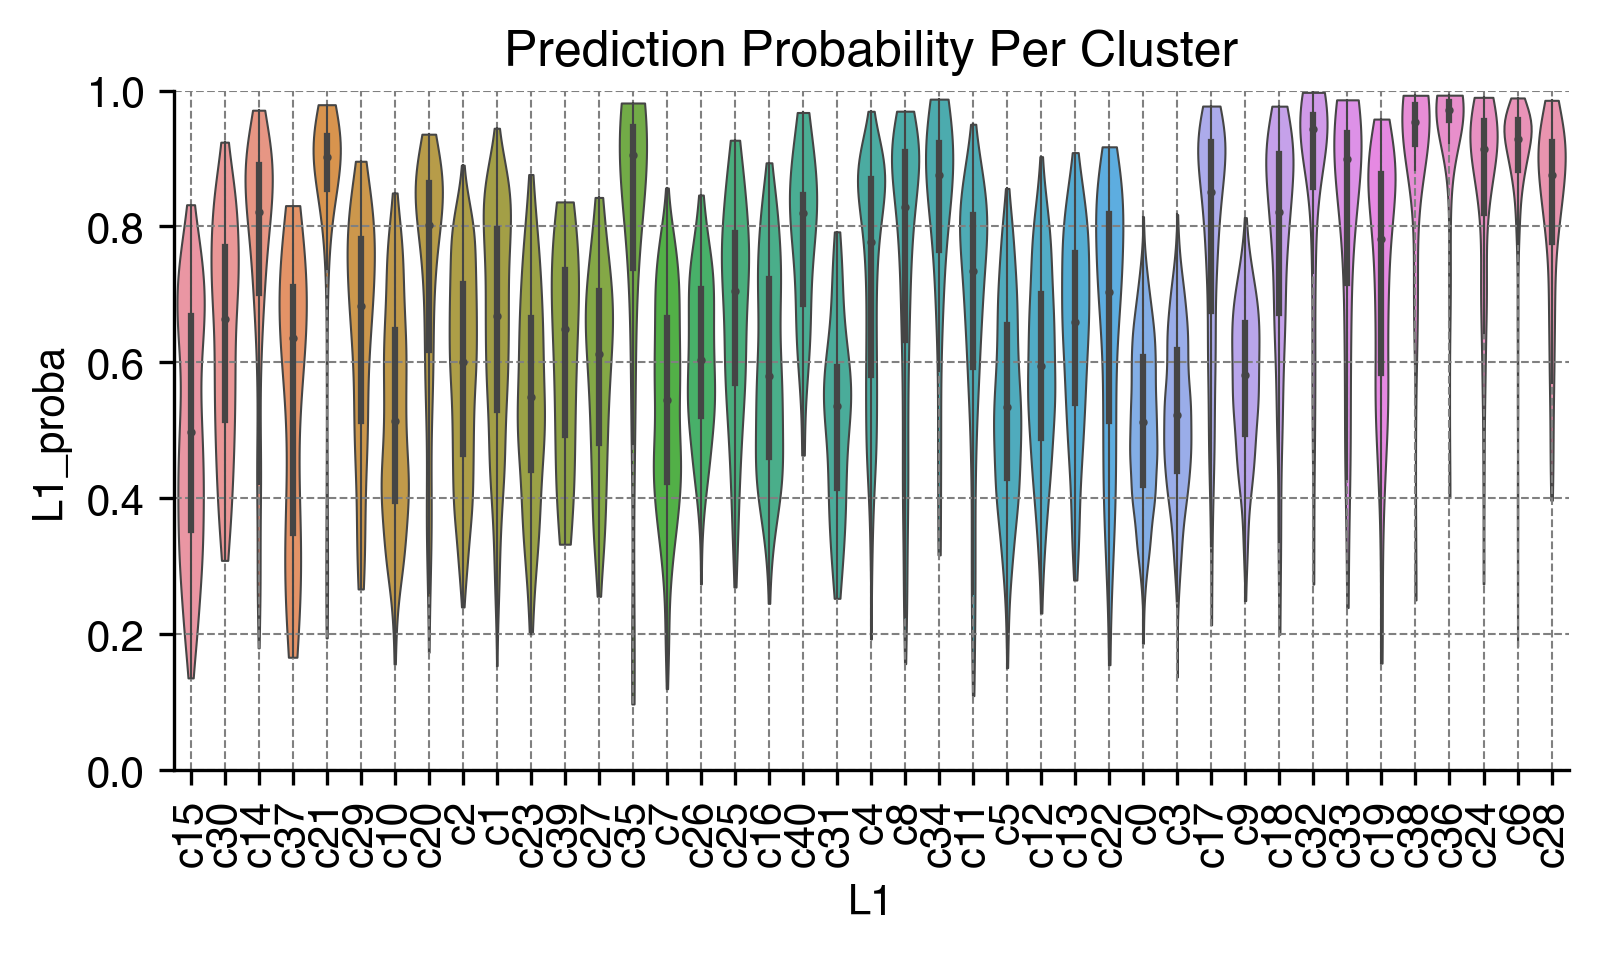
Prediction Probability Per Cluster
fig, ax = plt.subplots(figsize=(6, 3), dpi=300)

sns.violinplot(data=adata.obs,
               x=clustering_name,
               y=clustering_name + '_proba',
               scale='width',
               linewidth=0.5,
               cut=0,
               ax=ax)
ax.set(ylim=(0, 1), title='Prediction Probability Per Cluster')
ax.xaxis.set_tick_params(rotation=90)
ax.grid(linewidth=0.5, color='gray', linestyle='--')
sns.despine(ax=ax)
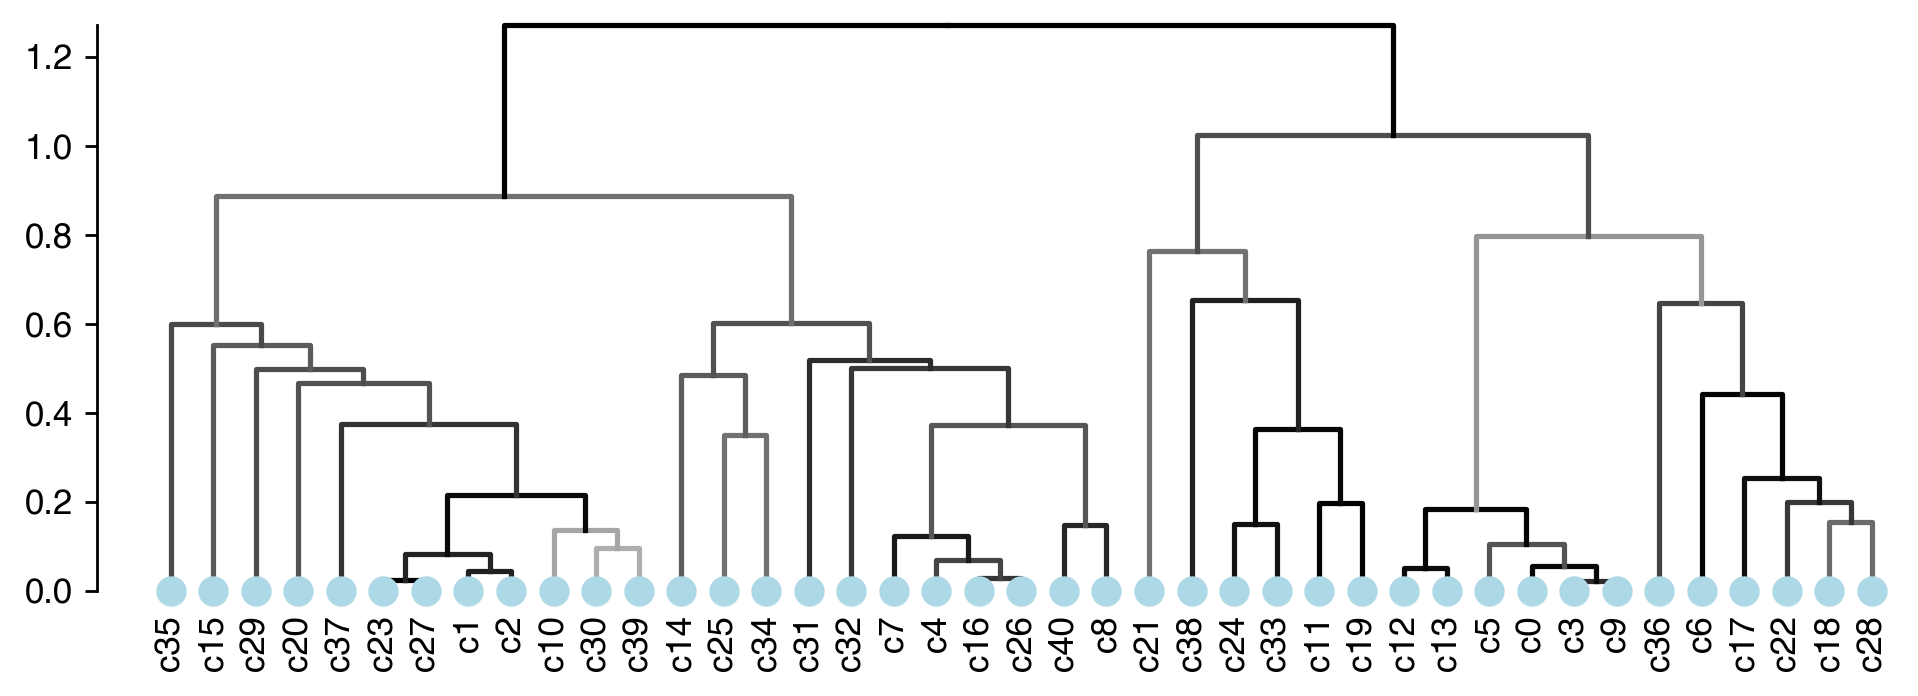
Calculate Cluster Dendrogram
# using the cluster centroids in PC space to calculate dendrogram
pc_center = get_pc_centers(adata, group=clustering_name)

# calculate the cluster dendrogram using R package pvclust
dendro = Dendrogram(nboot=nboot,
                    method_dist=method_dist,
                    method_hclust=method_hclust,
                    n_jobs=n_jobs)
dendro.fit(pc_center)
Creating a temporary cluster...done:
socket cluster with 40 nodes on host ‘localhost’
Multiscale bootstrap... Done.
fig, ax = plt.subplots(figsize=(9, 3), dpi=250)
_ = plot_dendrogram(dendro=dendro.dendrogram,
                    linkage_df=dendro.linkage,
                    ax=ax,
                    plot_non_singleton=False,
                    line_hue=dendro.edge_stats['au'], # au is the branch confidence score, see pvclust documentation
                    line_hue_norm=(0.5, 1))
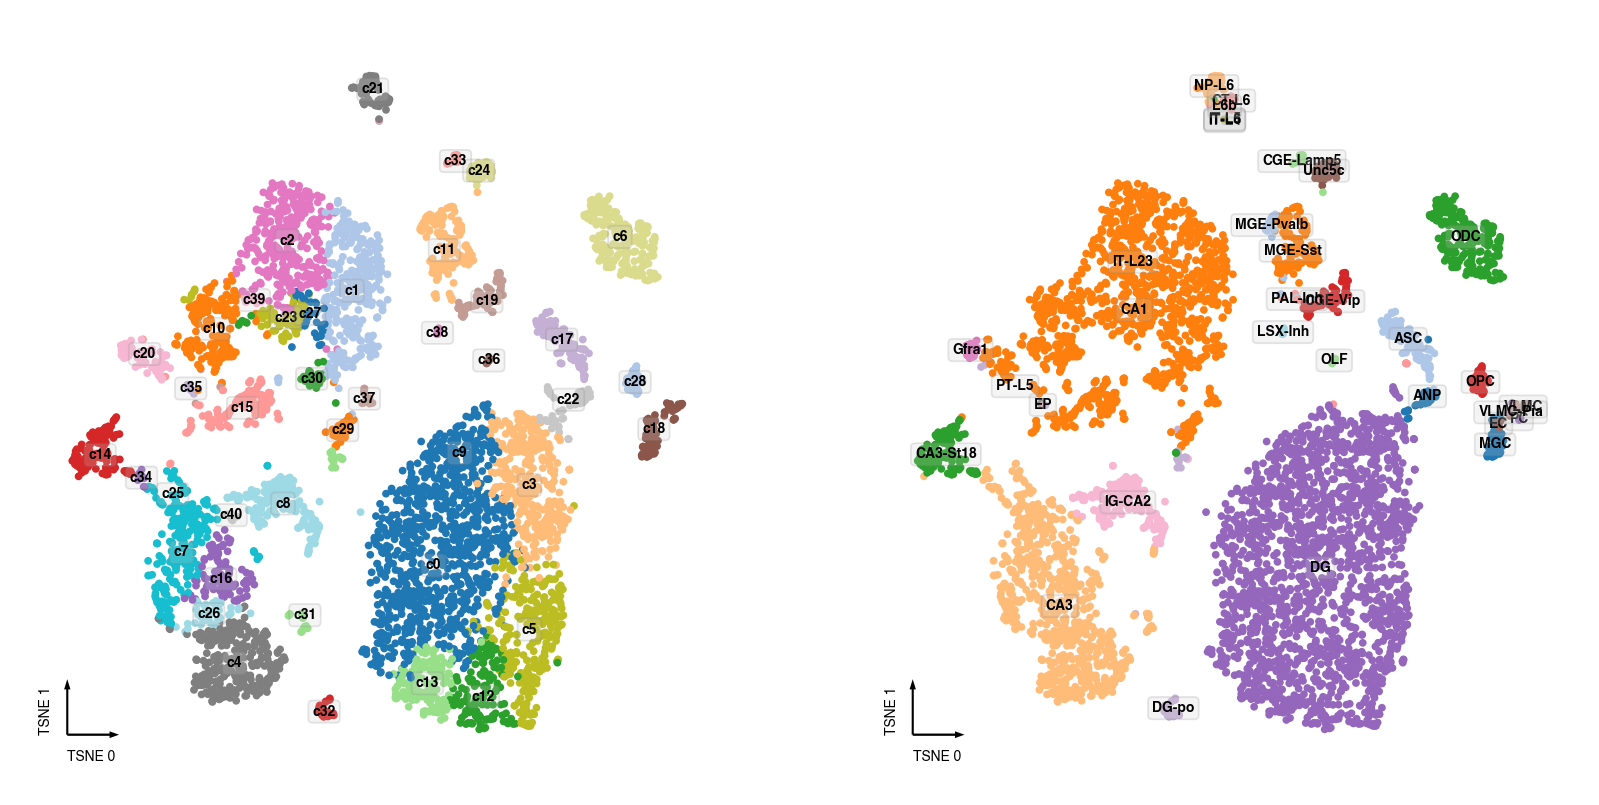
Sanity Test
try:
    anno = pd.read_csv(
    '../../../data/Brain/snmC-seq2/HIP.Annotated.CellMetadata.csv.gz',
    index_col=0)
    adata.obs['CellTypeAnno'] = anno['MajorType']
    fig, axes = plt.subplots(figsize=(8, 4), dpi=250, ncols=2)
    ax = axes[0]
    _ = categorical_scatter(data=adata.obs,
                            ax=ax,
                            hue=clustering_name,
                            coord_base=coord_base,
                            palette='tab20',
                            text_anno=clustering_name,
                            show_legend=False)
    ax = axes[1]
    _ = categorical_scatter(data=adata.obs.dropna(subset=['CellTypeAnno']),
                            ax=ax,
                            hue='CellTypeAnno',
                            coord_base=coord_base,
                            palette='tab20',
                            text_anno='CellTypeAnno',
                            show_legend=False)
except BaseException:
    pass
Save
cc.save(f'{clustering_name}.ConcensusClustering.model.lib')
dendro.save(f'{clustering_name}.Dendrogram.lib')
adata.write_h5ad(adata_path)
/home/hanliu/miniconda3/envs/allcools_new/lib/python3.8/site-packages/anndata/_core/anndata.py:1228: FutureWarning: The `inplace` parameter in pandas.Categorical.reorder_categories is deprecated and will be removed in a future version. Reordering categories will always return a new Categorical object.
  c.reorder_categories(natsorted(c.categories), inplace=True)
... storing 'L1' as categorical
/home/hanliu/miniconda3/envs/allcools_new/lib/python3.8/site-packages/anndata/_core/anndata.py:1228: FutureWarning: The `inplace` parameter in pandas.Categorical.reorder_categories is deprecated and will be removed in a future version. Reordering categories will always return a new Categorical object.
  c.reorder_categories(natsorted(c.categories), inplace=True)
... storing 'CellTypeAnno' as categorical
adata
AnnData object with n_obs × n_vars = 16985 × 3228
    obs: 'leiden', 'mCHFrac', 'tsne_0', 'tsne_1', 'L1', 'L1_proba', 'CellTypeAnno'
    var: 'bin_end', 'bin_start', 'chrom', 'CHN_mean', 'CHN_dispersion', 'CHN_cov', 'CHN_score', 'CHN_feature_select', 'leiden_enriched_features'
    uns: 'leiden', 'leiden_colors', 'leiden_feature_enrichment', 'leiden_sizes', 'log', 'neighbors', 'paga', 'umap'
    obsm: 'X_pca', 'X_tsne', 'X_umap'
    obsp: 'connectivities', 'distances'