Calculate Cell Doublet Score
Contents
Calculate Cell Doublet Score
Content
Here we assign a doublet score to each cell. The MethylScrblet method we used here is adapted from the Scrublet package [Wolock et al., 2019]. High doublet score indicates that the cell is likely merged from different cell types.
Prerequisite
Before this step, run the Basic Clustering Walk-through to get the cell-by-feature AnnData file.
Input
MCDS Files (contains chrom100K dim)
Cell Metadata
Output AnnData file from Basic Clustering Walk-through.
Output
Cell doublet score
Import
import pandas as pd
import matplotlib.pyplot as plt
import anndata

from ALLCools.clustering.doublets import MethylScrublet
from ALLCools.plot import *
from ALLCools.mcds import MCDS
Parameters
# change this to the paths to your MCDS files
mcds_paths = '../../data/Brain/snm*C-seq*/*.mcds'

adata_path = '../step_by_step/100kb/adata.with_coords.h5ad'
cef_path = '../step_by_step/100kb/L1_enriched_features.mCH.txt'
var_dim = 'chrom100k'
obs_dim = 'cell'
cluster_col = 'L1'

load = True
mc_type = 'CHN'

# Clustering resolution
n_neighbors = 10
expected_doublet_rate=0.06

plot_type = 'static'
Load
AnnData with clustering results
adata = anndata.read_h5ad(adata_path)

use_features = pd.read_csv(cef_path, index_col=0, header=None).index
use_features.name = var_dim
Raw mC counts
mcds = MCDS.open(mcds_paths, obs_dim=obs_dim, use_obs=adata.obs_names)
adata = adata[mcds.get_index(obs_dim), :].copy()
mc = mcds['chrom100k_da'].sel({
    'mc_type': mc_type,
    'count_type': 'mc',
    use_features.name: use_features
})
cov = mcds['chrom100k_da'].sel({
    'mc_type': mc_type,
    'count_type': 'cov',
    use_features.name: use_features
})

if load and (mcds.get_index('cell').size <= 20000):
    mc.load()
    cov.load()
Calculate Doublet Scores
scrublet = MethylScrublet(sim_doublet_ratio=2.0,
n_neighbors=n_neighbors,
expected_doublet_rate=expected_doublet_rate,
stdev_doublet_rate=0.02,
metric='euclidean',
random_state=0,
n_jobs=-1)
score, judge = scrublet.fit(mc, cov, clusters=adata.obs[cluster_col])
adata.obs['doublet_score'] = score
adata.obs['is_doublet'] = judge
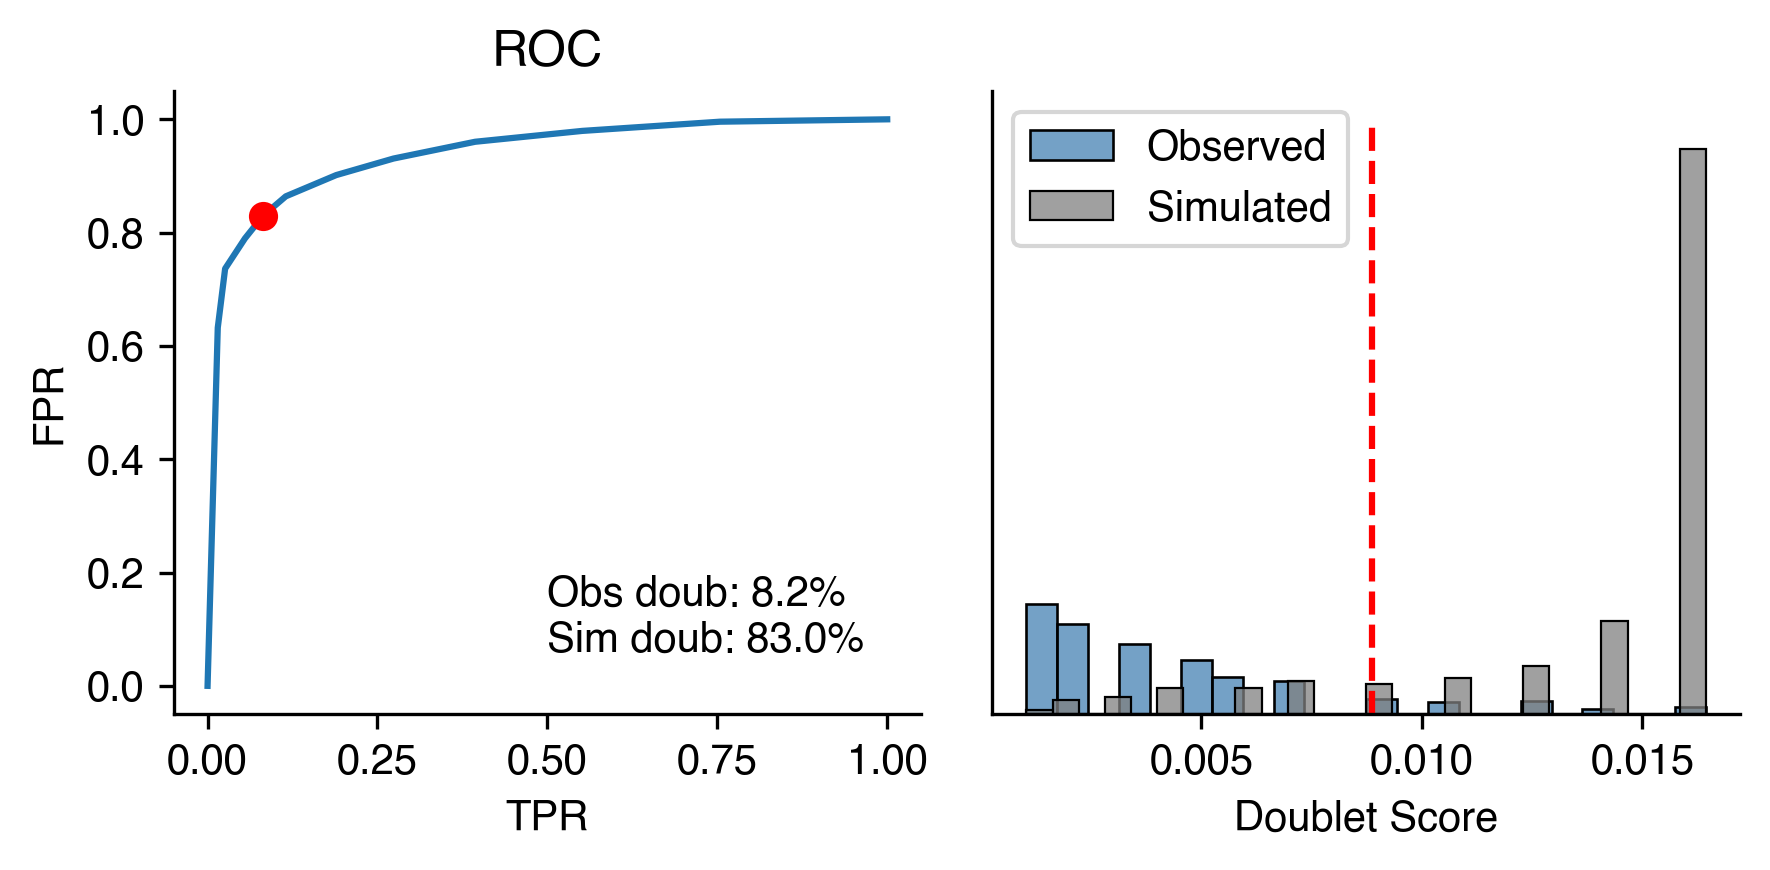
scrublet.plot()
Calculating mC frac of observations...
Simulating doublets...
Cell cluster labels are given, will sample similar number of cells from each cluster.
PCA...
Calculating doublet scores...
Automatically set threshold to 0.01
Detected doublet rate = 8.2%
Estimated detectable doublet fraction = 83.0%
Overall doublet rate:
	Expected   = 6.0%
	Estimated  = 9.8%
fig, ax = plt.subplots(figsize=(4, 4), dpi=250)
_ = categorical_scatter(data=adata.obs, ax=ax, coord_base='umap', hue=cluster_col, show_legend=True)
fig, ax = plt.subplots(figsize=(4, 4), dpi=250)
_ = continuous_scatter(data=adata.obs, ax=ax, coord_base='umap', hue='doublet_score')
Plots
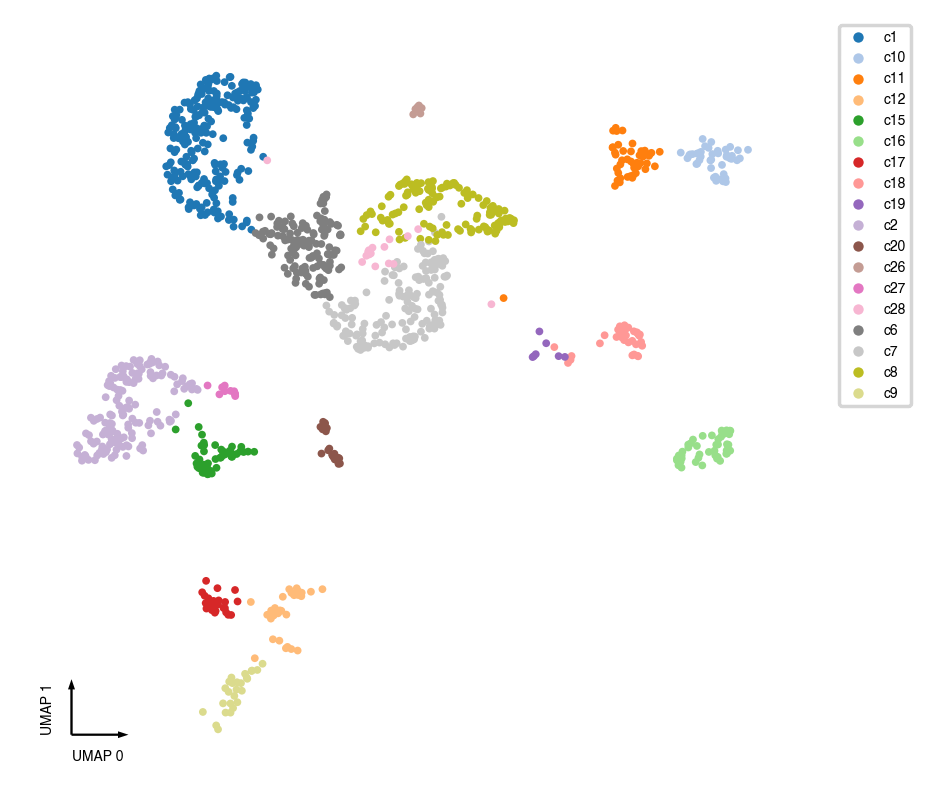
fig, ax = plt.subplots(figsize=(4, 4), dpi=250)
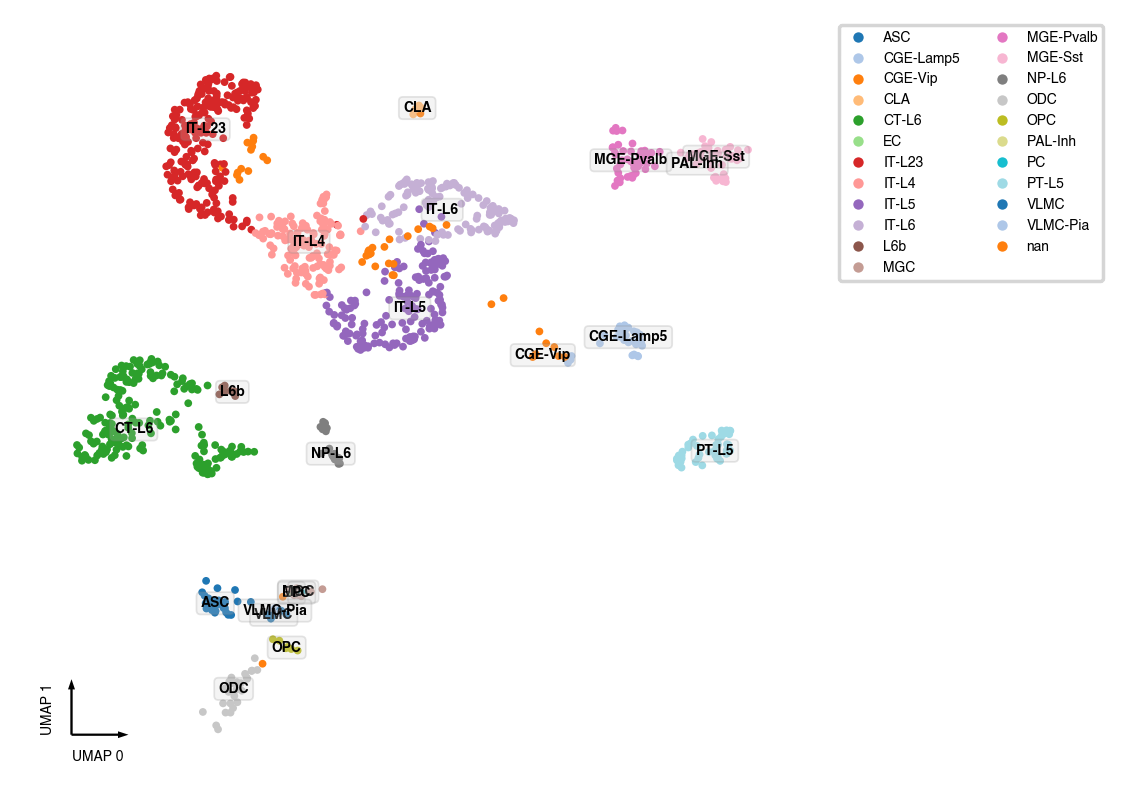
_ = categorical_scatter(data=adata.obs,
ax=ax,
coord_base='umap',
hue='CellTypeAnno',
text_anno='CellTypeAnno',
palette='tab20',
show_legend=True)
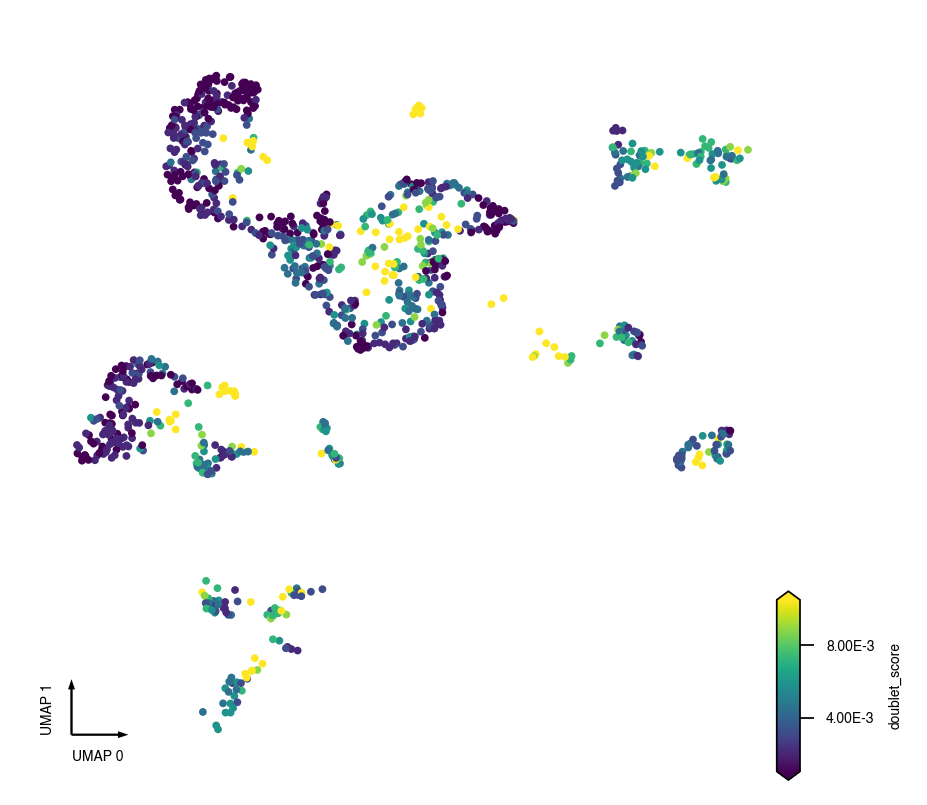
fig, ax = plt.subplots(figsize=(4, 4), dpi=250)
_ = continuous_scatter(data=adata.obs, ax=ax, coord_base='umap', hue='doublet_score')

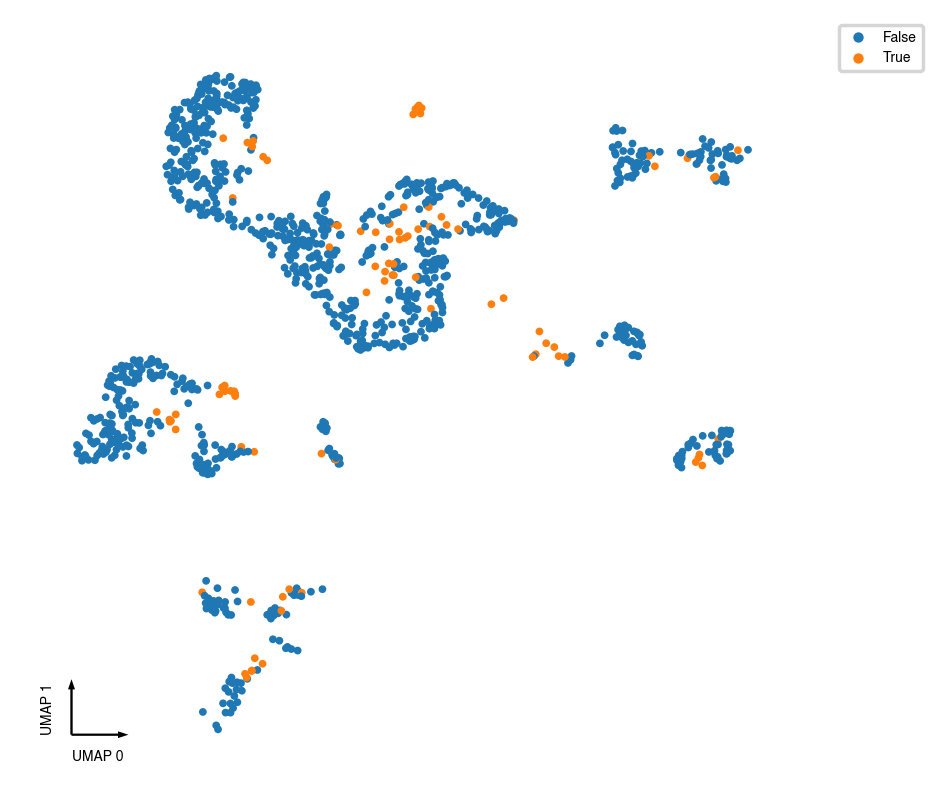
fig, ax = plt.subplots(figsize=(4, 4), dpi=250)
_ = categorical_scatter(data=adata.obs, ax=ax, coord_base='umap', hue='is_doublet', show_legend=True)